## Line Chart: Volume vs. Number of Points for Two Methods
### Overview
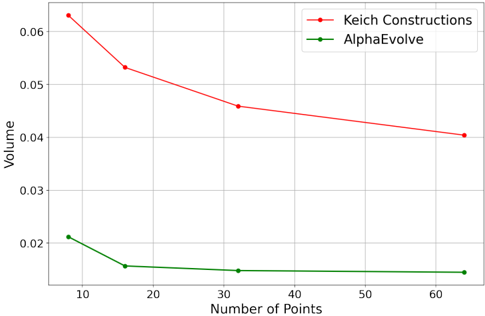
The image displays a line chart comparing the performance of two methods, "Keich Constructions" and "AlphaEvolve," by plotting a metric called "Volume" against the "Number of Points." Both methods show a decreasing trend in Volume as the Number of Points increases, but they operate at distinctly different scales and exhibit different rates of change.
### Components/Axes
* **Chart Type:** Line chart with two data series.
* **X-Axis:**
* **Label:** "Number of Points"
* **Scale:** Linear scale.
* **Markers:** Major tick marks are present at 10, 20, 30, 40, 50, and 60.
* **Y-Axis:**
* **Label:** "Volume"
* **Scale:** Linear scale.
* **Range:** Approximately 0.015 to 0.065.
* **Markers:** Major tick marks are present at 0.02, 0.03, 0.04, 0.05, and 0.06.
* **Legend:**
* **Position:** Top-right corner of the chart area.
* **Series 1:** "Keich Constructions" - Represented by a red line with circular markers.
* **Series 2:** "AlphaEvolve" - Represented by a green line with circular markers.
* **Grid:** A light gray grid is present in the background.
### Detailed Analysis
**1. Keich Constructions (Red Line):**
* **Trend:** The line shows a clear, consistent downward slope from left to right, indicating that Volume decreases as the Number of Points increases.
* **Data Points (Approximate):**
* At ~10 Points: Volume ≈ 0.063
* At ~20 Points: Volume ≈ 0.053
* At ~30 Points: Volume ≈ 0.046
* At ~60 Points: Volume ≈ 0.041
* **Rate of Change:** The decrease is steepest between 10 and 20 points and becomes more gradual after 30 points.
**2. AlphaEvolve (Green Line):**
* **Trend:** The line also slopes downward but is much flatter overall. It shows an initial decrease followed by a near-plateau.
* **Data Points (Approximate):**
* At ~10 Points: Volume ≈ 0.021
* At ~20 Points: Volume ≈ 0.016
* At ~30 Points: Volume ≈ 0.015
* At ~60 Points: Volume ≈ 0.015
* **Rate of Change:** The most significant drop occurs between 10 and 20 points. From 30 points onward, the Volume appears to stabilize at approximately 0.015.
### Key Observations
1. **Scale Difference:** The "Keich Constructions" method consistently results in a significantly higher Volume (roughly 2.5 to 3 times higher) than "AlphaEvolve" across all measured points.
2. **Convergence Behavior:** While both methods improve (lower Volume) with more points, "AlphaEvolve" reaches a stable minimum Volume much earlier (around 30 points) compared to "Keich Constructions," which is still showing a slight downward trend at 60 points.
3. **Relative Performance Gap:** The absolute difference in Volume between the two methods narrows slightly as the number of points increases, from a difference of ~0.042 at 10 points to ~0.026 at 60 points.
### Interpretation
This chart likely compares the efficiency or output quality (where lower "Volume" is better) of two algorithms or construction methods as a function of input complexity or resource allocation ("Number of Points").
* **AlphaEvolve** appears to be a more efficient method, achieving a low, stable Volume with relatively few points. Its performance plateaus quickly, suggesting it may reach an optimal or near-optimal state early in the process.
* **Keich Constructions** operates at a higher Volume scale and shows continuous, albeit diminishing, returns as more points are added. This could indicate a method that is more resource-intensive or one that continues to refine its output with greater input, potentially at a higher computational or material cost.
The data suggests a trade-off: AlphaEvolve offers lower Volume (potentially better performance) with fewer resources, while Keich Constructions may be used in scenarios where its specific output characteristics are required, despite the higher Volume, or where the gradual improvement with scale is desirable. The investigation would benefit from knowing the exact definition of "Volume" and the context of the "Points" to fully understand the practical implications of this performance gap.