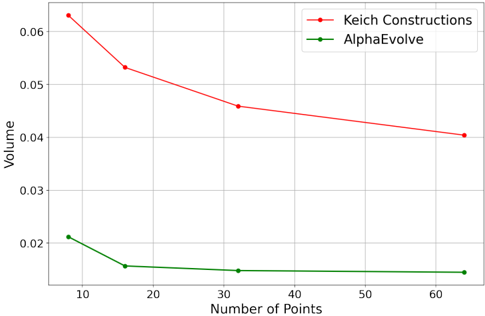
## Line Graph: Volume Comparison of Keich Constructions vs AlphaEvolve
### Overview
The image shows a line graph comparing the volume performance of two methods ("Keich Constructions" and "AlphaEvolve") across increasing numbers of points (10 to 60). The y-axis represents volume (0.01 to 0.06), and the x-axis represents the number of points. Two distinct trends are visible: a declining red line (Keich) and a plateauing green line (AlphaEvolve).
### Components/Axes
- **X-axis**: "Number of Points" (10, 20, 30, 40, 50, 60)
- **Y-axis**: "Volume" (0.01 to 0.06 in increments of 0.01)
- **Legend**: Located in the top-right corner, with:
- Red line: "Keich Constructions"
- Green line: "AlphaEvolve"
### Detailed Analysis
#### Keich Constructions (Red Line)
- **Trend**: Steady linear decline from ~0.065 at 10 points to ~0.039 at 60 points.
- **Key Data Points**:
- 10 points: ~0.065
- 20 points: ~0.053
- 30 points: ~0.045
- 40 points: ~0.042
- 50 points: ~0.040
- 60 points: ~0.039
#### AlphaEvolve (Green Line)
- **Trend**: Sharp initial drop followed by stabilization.
- **Key Data Points**:
- 10 points: ~0.021
- 20 points: ~0.015
- 30 points: ~0.014
- 40 points: ~0.014
- 50 points: ~0.014
- 60 points: ~0.014
### Key Observations
1. **Keich Constructions** shows a consistent ~0.0015 volume decrease per 10-point increment.
2. **AlphaEvolve** experiences a ~0.006 volume drop between 10 and 20 points, then stabilizes.
3. At 60 points, Keich retains ~2.8x more volume than AlphaEvolve.
4. AlphaEvolve's plateau suggests diminishing returns after 20 points.
### Interpretation
The data suggests **Keich Constructions** maintains higher volume efficiency as the number of points increases, while **AlphaEvolve** prioritizes rapid initial volume reduction but offers no further gains beyond 20 points. This could indicate:
- Keich is better suited for high-complexity scenarios (more points).
- AlphaEvolve optimizes for simplicity or early-stage performance.
- The sharp drop in AlphaEvolve's volume might reflect a threshold effect or resource limitation.
No textual content in other languages was detected. All values are approximate, with uncertainty increasing for points beyond 30 due to the graph's resolution.