## Pie Chart: Average Time Distribution for Each Part of our BoT
### Overview
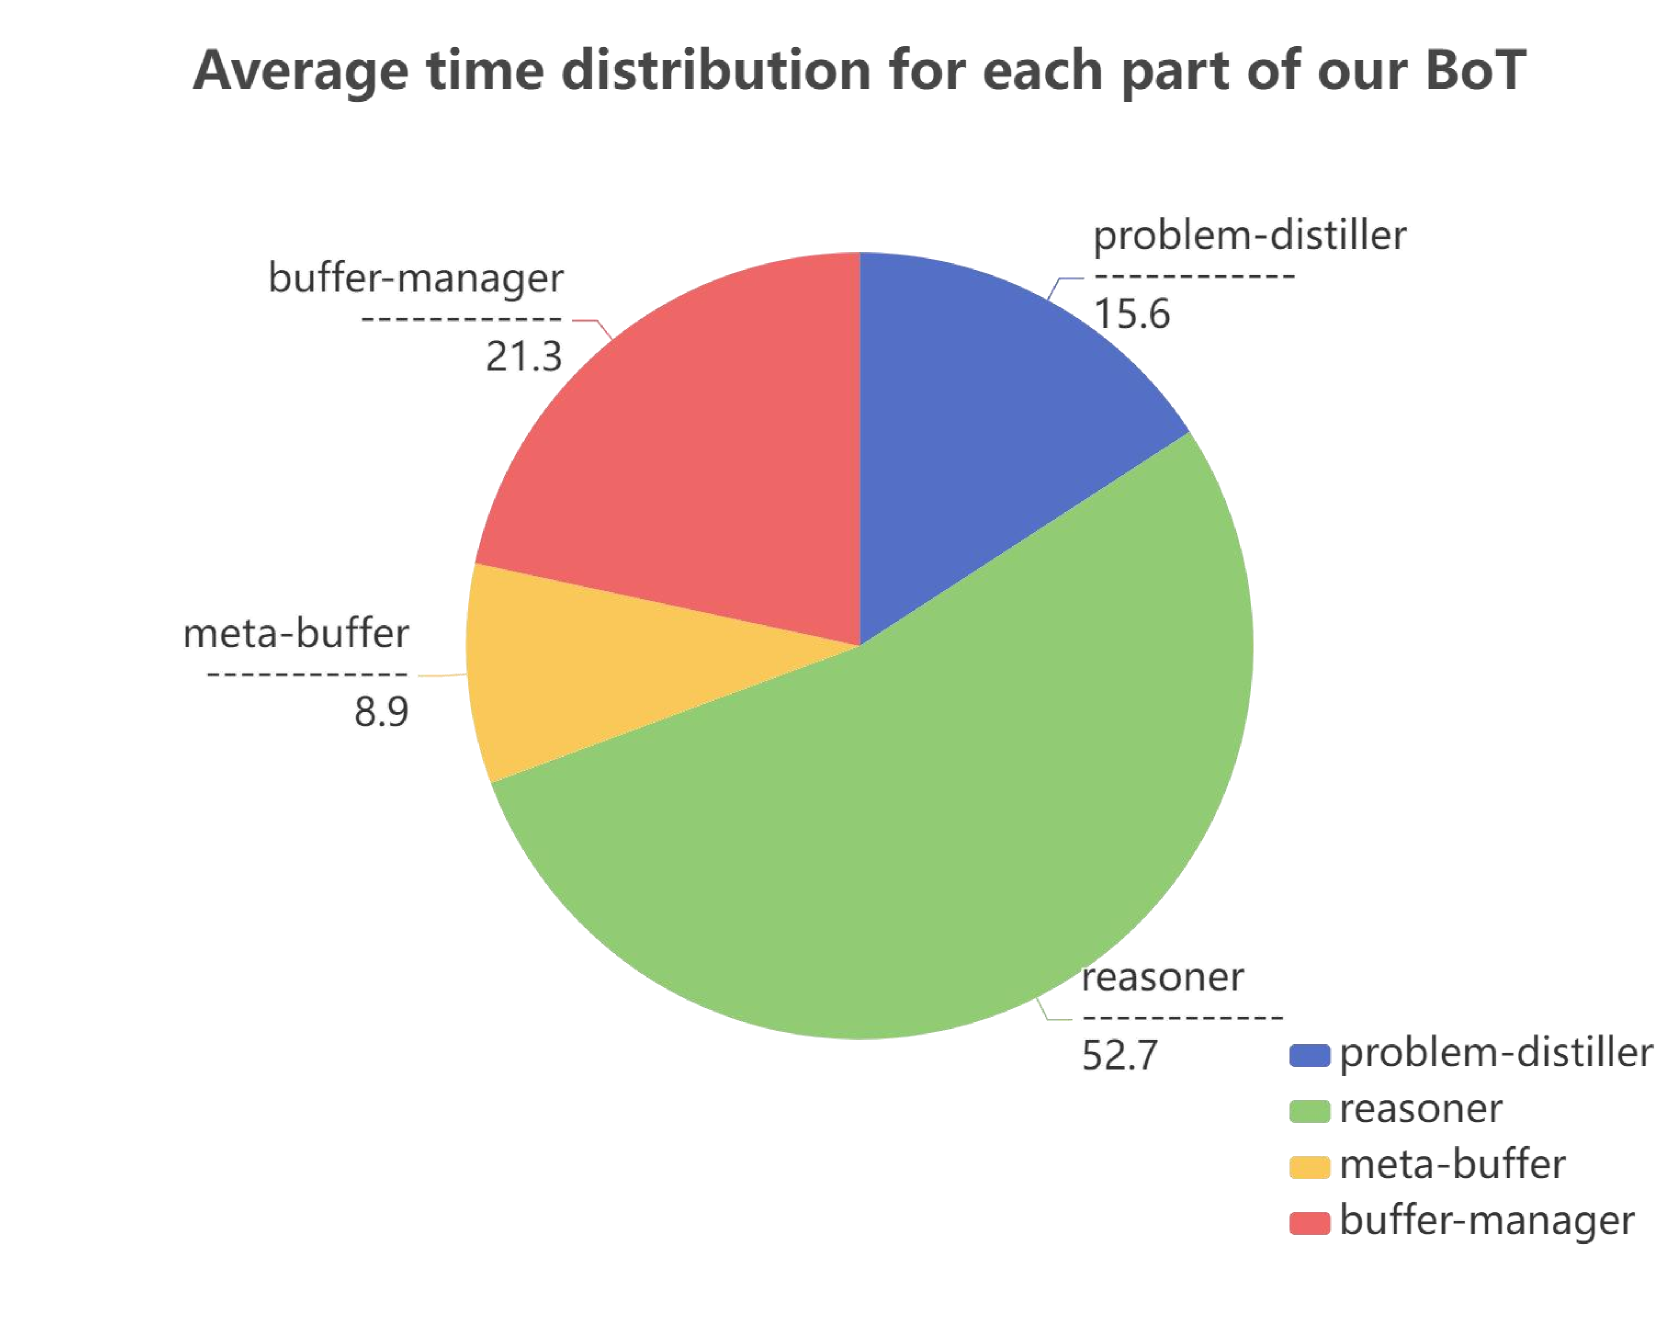
The image is a pie chart illustrating the average time distribution for different components of a "BoT". The chart is divided into four sections, each representing a component: problem-distiller, reasoner, meta-buffer, and buffer-manager. The size of each slice corresponds to the percentage of time spent on that component.
### Components/Axes
* **Title:** Average time distribution for each part of our BoT
* **Slices:**
* **problem-distiller:** Blue, 15.6
* **reasoner:** Green, 52.7
* **meta-buffer:** Yellow, 8.9
* **buffer-manager:** Red, 21.3
* **Legend:** Located in the bottom-right corner, mapping colors to components.
* Blue: problem-distiller
* Green: reasoner
* Yellow: meta-buffer
* Red: buffer-manager
### Detailed Analysis
The pie chart shows the proportion of time spent on each component of the BoT. The "reasoner" component takes up the largest portion of time (52.7%), followed by "buffer-manager" (21.3%), "problem-distiller" (15.6%), and "meta-buffer" (8.9%).
* **problem-distiller:** 15.6, represented by the blue slice in the top-right quadrant.
* **reasoner:** 52.7, represented by the green slice, occupying the largest portion of the pie chart in the bottom-right quadrant.
* **meta-buffer:** 8.9, represented by the yellow slice in the bottom-left quadrant.
* **buffer-manager:** 21.3, represented by the red slice in the top-left quadrant.
### Key Observations
* The "reasoner" component consumes the majority of the time, accounting for over half of the total time distribution.
* The "meta-buffer" component consumes the least amount of time.
* The "buffer-manager" consumes a significant portion of time, more than the "problem-distiller".
### Interpretation
The pie chart provides a clear visualization of the time allocation among different components of the BoT. The dominance of the "reasoner" component suggests that the BoT spends a significant amount of time on reasoning tasks. The relatively small proportion of time spent on the "meta-buffer" component might indicate that this component is highly efficient or less frequently used. The data suggests that optimizing the "reasoner" component could lead to the most significant improvements in overall BoT performance. The "buffer-manager" also represents a significant portion of time, so optimizing this component could also yield improvements.