\n
## Pie Chart: Average Time Distribution for Each Part of Our BoT
### Overview
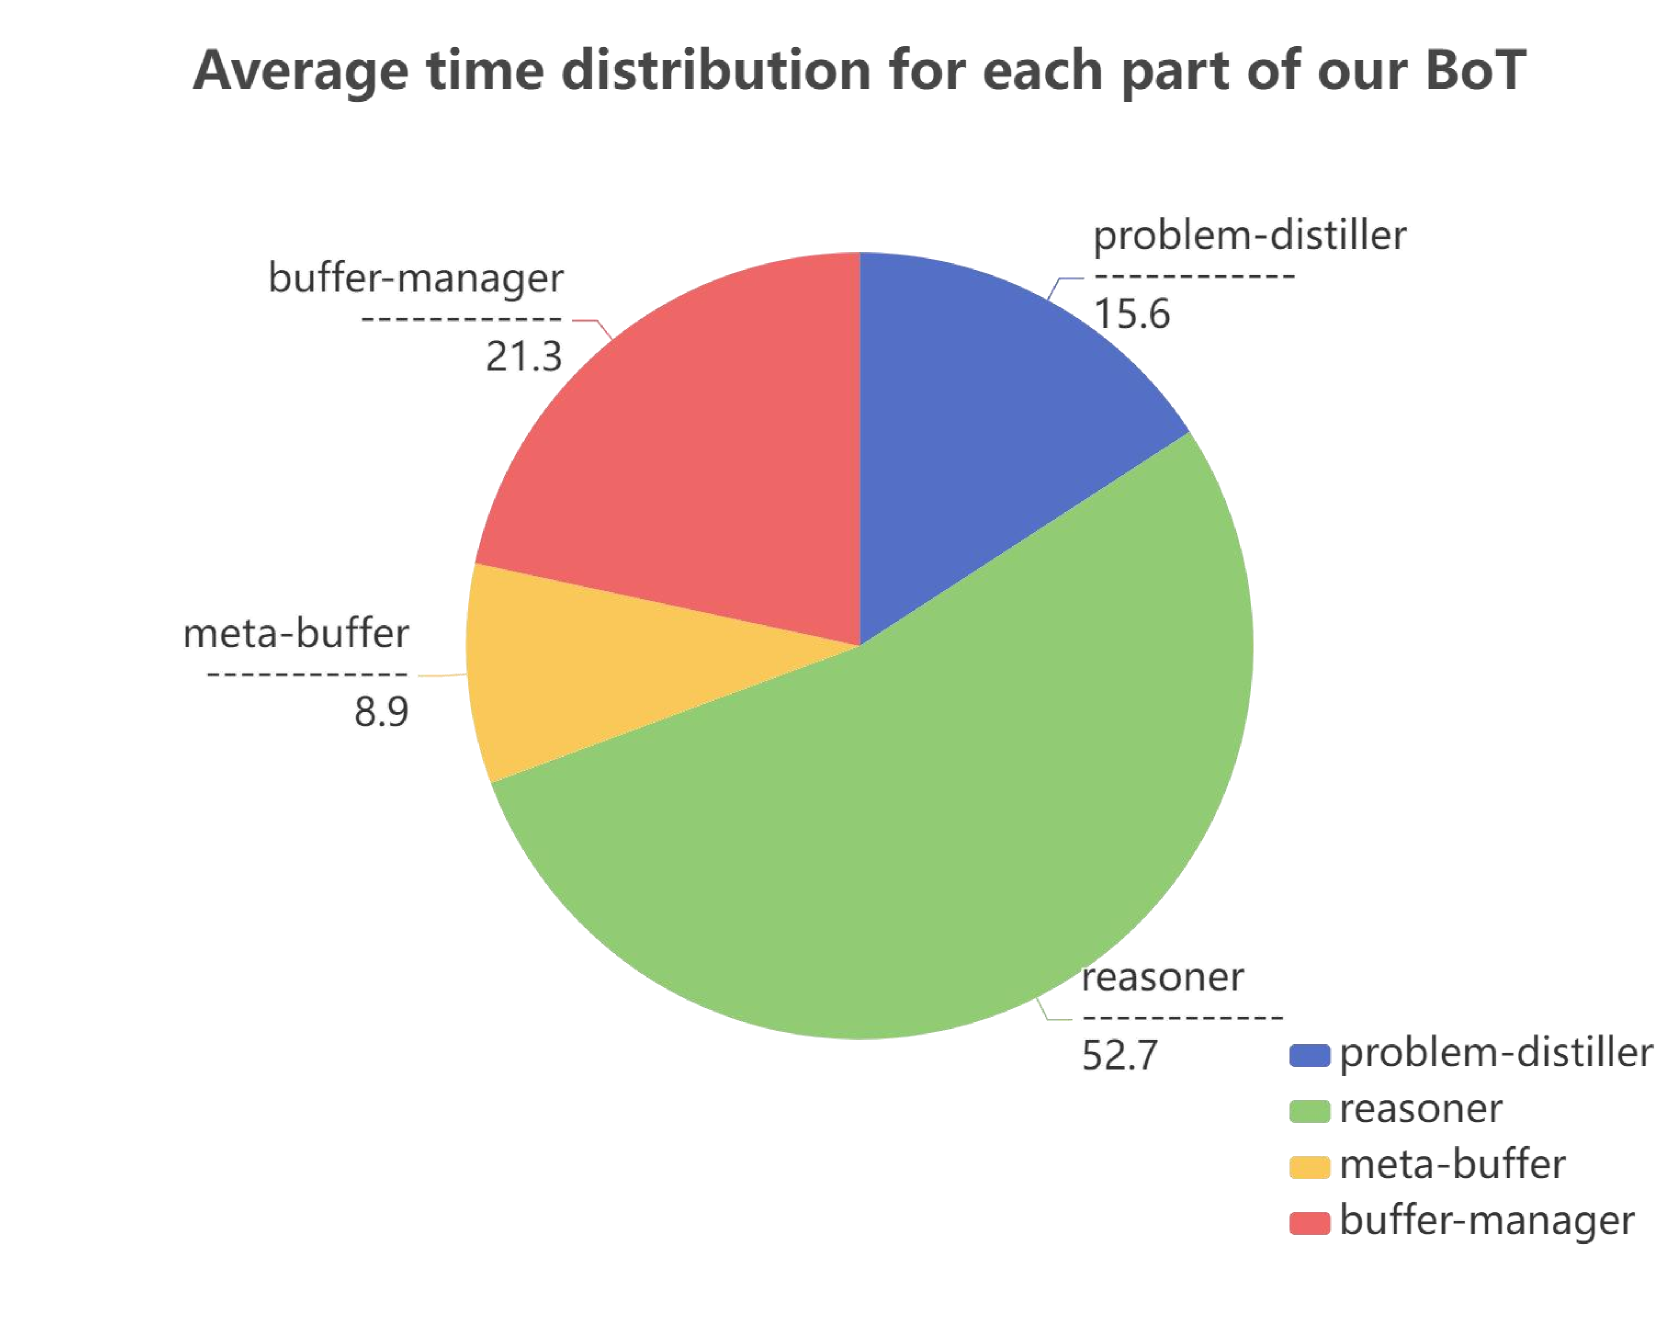
This image presents a pie chart illustrating the average time distribution across different components of a "BoT" (likely a bot or automated system). The chart visually breaks down the percentage of time spent in each component: problem-distiller, reasoner, meta-buffer, and buffer-manager.
### Components/Axes
* **Title:** Average time distribution for each part of our BoT
* **Legend:** Located in the bottom-right corner.
* problem-distiller (Blue)
* reasoner (Green)
* meta-buffer (Yellow)
* buffer-manager (Red)
* **Data Labels:** Displayed directly on each pie slice, indicating the percentage of time allocated to each component.
### Detailed Analysis
The pie chart is divided into four segments, each representing a component of the BoT and its corresponding time allocation.
* **Reasoner:** This component occupies the largest portion of the pie chart, representing approximately 52.7% of the total time. The segment is colored green.
* **Buffer-manager:** This component occupies approximately 21.3% of the total time. The segment is colored red.
* **Problem-distiller:** This component occupies approximately 15.6% of the total time. The segment is colored blue.
* **Meta-buffer:** This component occupies the smallest portion of the pie chart, representing approximately 8.9% of the total time. The segment is colored yellow.
### Key Observations
* The "Reasoner" component dominates the time distribution, consuming over half of the total time.
* The "Buffer-manager" component accounts for a significant portion of the time, nearly a quarter.
* The "Problem-distiller" and "Meta-buffer" components contribute relatively smaller percentages to the overall time distribution.
### Interpretation
The data suggests that the "Reasoner" component is the most computationally intensive or frequently used part of the BoT. This could indicate that the core logic or decision-making process within the BoT relies heavily on this component. The substantial time spent in the "Buffer-manager" suggests that data handling or queuing is a significant aspect of the BoT's operation. The relatively low time allocation to the "Problem-distiller" and "Meta-buffer" might imply that these components are less frequently invoked or have simpler processing requirements.
The chart provides insight into the performance bottlenecks or areas for optimization within the BoT. If the goal is to improve the overall efficiency, focusing on optimizing the "Reasoner" component would likely yield the most significant gains. Further investigation into the specific tasks performed by each component could reveal opportunities for streamlining processes and reducing time consumption.