## [Pie Chart]: Average time distribution for each part of our BoT
### Overview
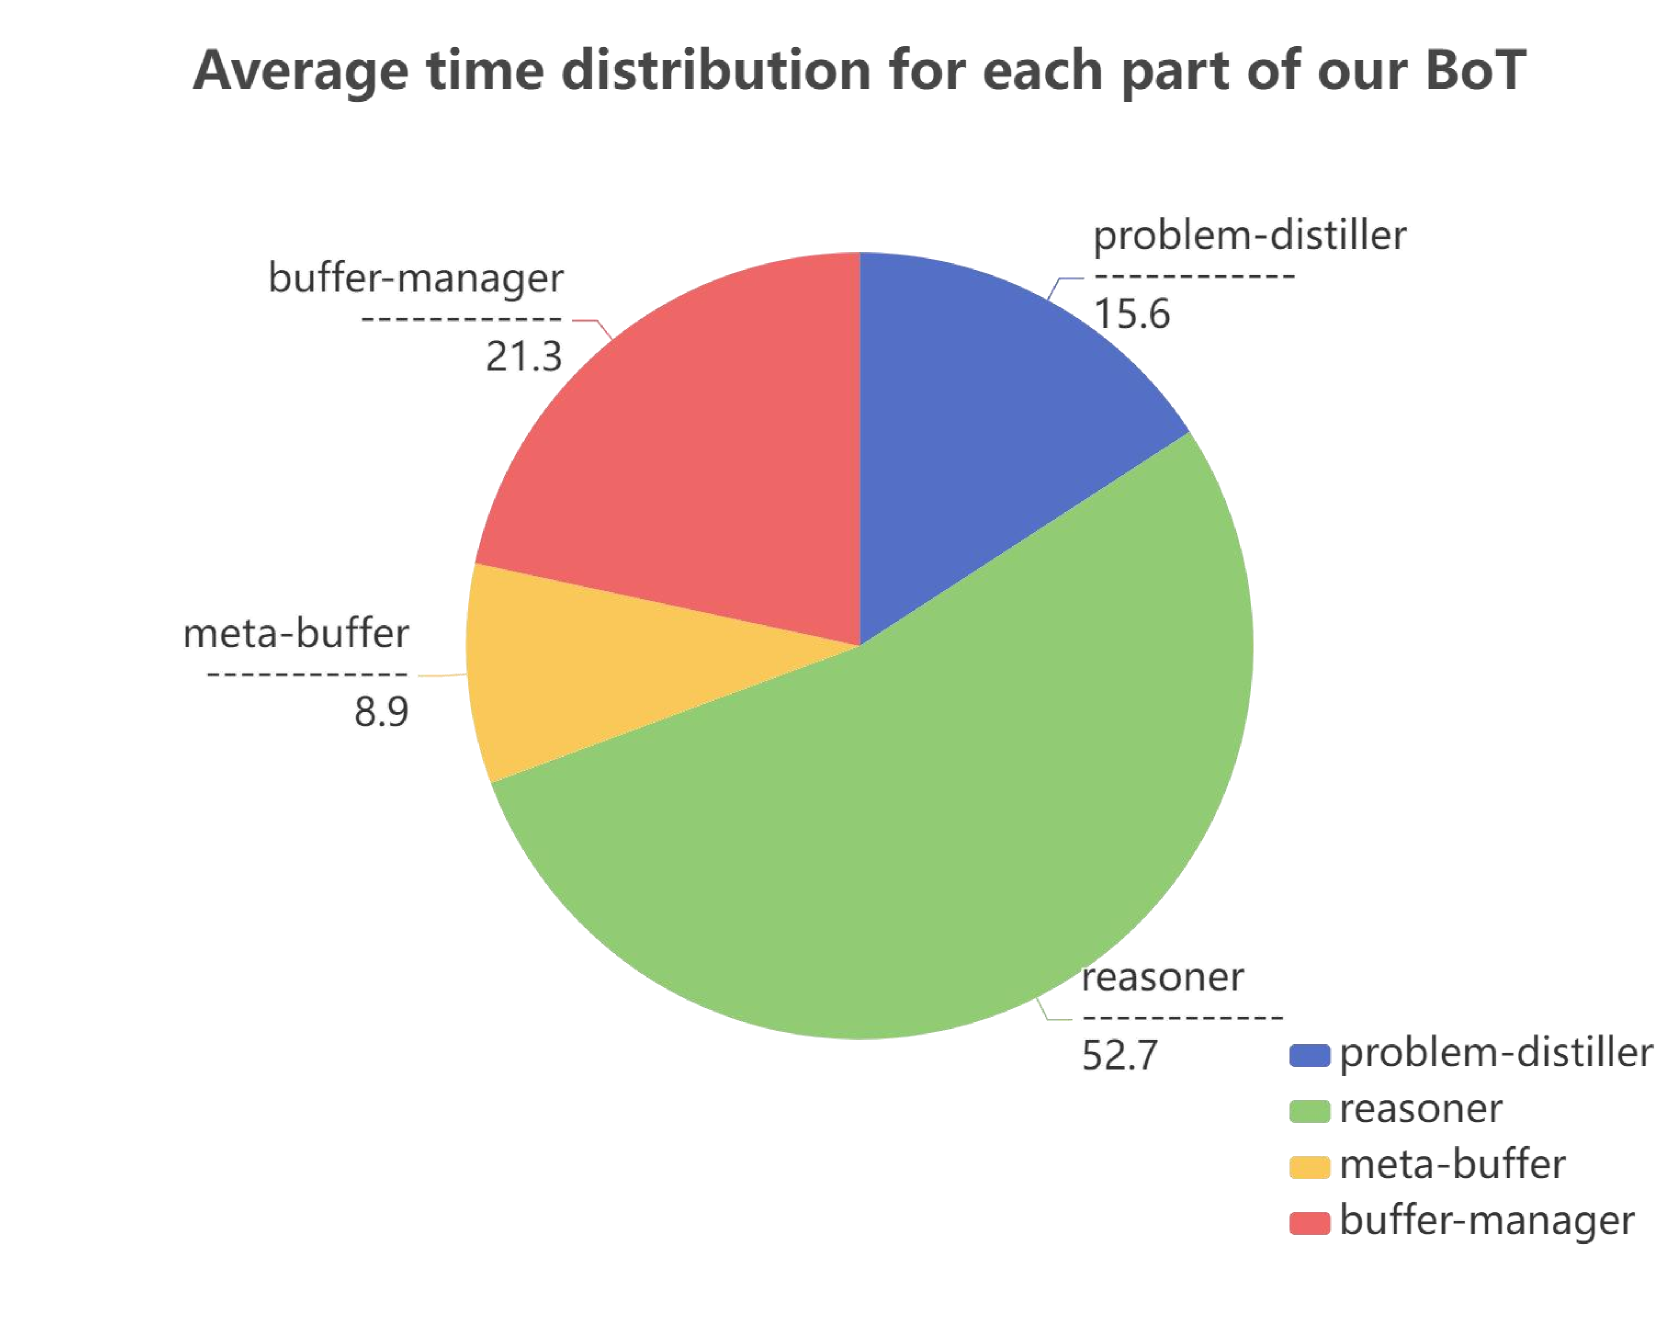
This image is a pie chart titled "Average time distribution for each part of our BoT". It displays the proportional distribution of average time spent across four distinct components of a system referred to as "BoT". The chart uses color-coded segments with direct labels and a supporting legend.
### Components/Axes
* **Title:** "Average time distribution for each part of our BoT" (Top center).
* **Chart Type:** Pie chart.
* **Segments & Labels:** Four segments, each labeled with a component name and a numerical value. Labels are connected to their respective segments by dashed lines.
* **Blue Segment:** Labeled "problem-distiller" with a value of "15.6".
* **Green Segment:** Labeled "reasoner" with a value of "52.7".
* **Yellow Segment:** Labeled "meta-buffer" with a value of "8.9".
* **Red Segment:** Labeled "buffer-manager" with a value of "21.3".
* **Legend:** Located at the bottom-right corner. It maps colors to component names:
* Blue square: "problem-distiller"
* Green square: "reasoner"
* Yellow square: "meta-buffer"
* Red square: "buffer-manager"
### Detailed Analysis
The pie chart segments represent the following data points, which sum to 98.5 (likely due to rounding):
1. **reasoner (Green):** 52.7
2. **buffer-manager (Red):** 21.3
3. **problem-distiller (Blue):** 15.6
4. **meta-buffer (Yellow):** 8.9
**Spatial Grounding & Trend Verification:**
* The **green "reasoner"** segment is the largest, occupying slightly more than half of the pie chart (from approximately the 3 o'clock to 9 o'clock position, moving clockwise).
* The **red "buffer-manager"** segment is the second largest, located in the upper-left quadrant (from ~9 o'clock to 12 o'clock).
* The **blue "problem-distiller"** segment is the third largest, located in the upper-right quadrant (from ~12 o'clock to 3 o'clock).
* The **yellow "meta-buffer"** segment is the smallest, a thin slice between the red and green segments on the left side.
### Key Observations
* The "reasoner" component consumes the majority of the average time (52.7), which is more than the combined time of all other components.
* The "meta-buffer" is the least time-consuming part at 8.9.
* The distribution is highly skewed, with one dominant component ("reasoner") and three supporting components.
### Interpretation
This chart visualizes the computational or processing bottleneck within the "BoT" system. The data strongly suggests that the **"reasoner" is the core and most resource-intensive component**, accounting for over half of the total average time. This indicates that any performance optimization efforts should prioritize this module for the greatest impact.
The other components—"buffer-manager", "problem-distiller", and "meta-buffer"—play supporting roles, with the "buffer-manager" being the most significant among them. The "meta-buffer" appears to be a lightweight, auxiliary function. The chart effectively communicates where system time is allocated, guiding developers or analysts toward the most critical area for investigation or improvement. The term "BoT" is not defined in the image but likely stands for a specific system architecture (e.g., "Buffer of Thoughts," "Bot," or a proprietary acronym).