## Diagram: Utility Dependence Graph and Tree Decomposition
### Overview
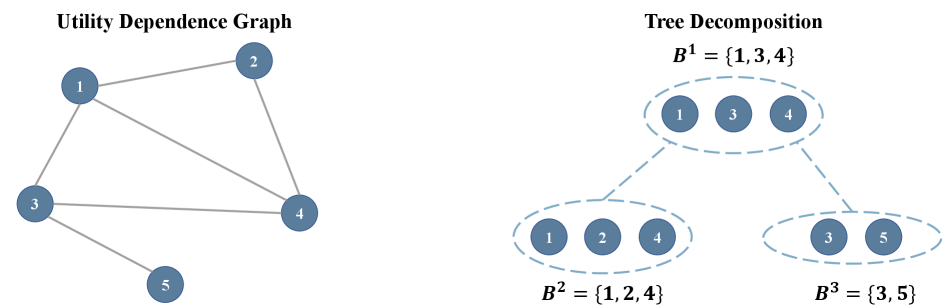
The image contains two interconnected diagrams:
1. **Left**: A **Utility Dependence Graph** with 5 nodes (1–5) and edges representing dependencies.
2. **Right**: A **Tree Decomposition** of the graph, partitioned into three clusters (B¹, B², B³) with overlapping node sets.
### Components/Axes
#### Utility Dependence Graph
- **Nodes**: Labeled 1, 2, 3, 4, 5 (blue circles).
- **Edges**: Undirected connections between nodes:
- 1–2, 1–3, 1–4, 2–4, 3–4, 3–5.
- **No explicit axis titles or legends**; edges are gray lines.
#### Tree Decomposition
- **Clusters**:
- **B¹**: {1, 3, 4} (top oval).
- **B²**: {1, 2, 4} (bottom-left oval).
- **B³**: {3, 5} (bottom-right oval).
- **Connections**: Dashed lines link clusters:
- B¹ ↔ B², B¹ ↔ B³.
- **Node placement**: Nodes are repeated in overlapping clusters (e.g., node 1 in B¹ and B²).
### Detailed Analysis
#### Utility Dependence Graph
- **Node degrees**:
- Node 1: Degree 3 (connected to 2, 3, 4).
- Node 3: Degree 3 (connected to 1, 4, 5).
- Nodes 2, 4, 5: Degree 2 or 1.
- **Connectivity**: Fully connected except for node 5, which only links to node 3.
#### Tree Decomposition
- **Cluster overlaps**:
- B¹ and B² share nodes 1 and 4.
- B¹ and B³ share node 3.
- **Tree structure**: B¹ acts as a central hub connecting B² and B³.
### Key Observations
1. **Utility Graph**: Node 3 is a critical hub, connecting to three other nodes.
2. **Tree Decomposition**: Clusters B¹, B², and B³ ensure all original edges are covered (e.g., edge 3–5 is in B³, edge 1–2 is in B²).
3. **Overlap strategy**: Shared nodes (e.g., 1, 3, 4) maintain dependencies across clusters.
### Interpretation
- The **Tree Decomposition** transforms the cyclic Utility Graph into a tree-like structure, breaking dependencies into manageable subgraphs (clusters).
- **B¹** serves as the root cluster, ensuring connectivity between B² and B³.
- This decomposition is likely used for algorithms requiring tree structures (e.g., dynamic programming on graphs).
- **Critical insight**: Node 3’s role in both B¹ and B³ highlights its importance in maintaining dependencies between clusters.
## No numerical data or trends present; analysis focuses on structural relationships.