## Bar Chart: Accuracy vs. Model Size for Different Verification Types
### Overview
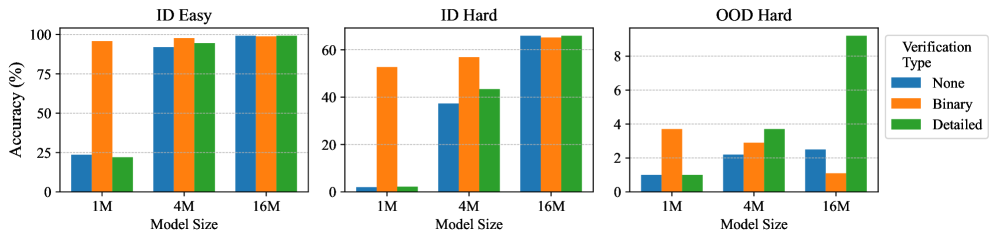
The image presents three bar charts comparing the accuracy of different verification types (None, Binary, Detailed) across varying model sizes (1M, 4M, 16M). The charts are grouped by difficulty level: "ID Easy", "ID Hard", and "OOD Hard". Accuracy is measured as a percentage.
### Components/Axes
* **X-axis (Model Size):** Categorical axis with three values: 1M, 4M, 16M.
* **Y-axis (Accuracy (%)):** Numerical axis ranging from 0% to 100% for "ID Easy", 0 to 60% for "ID Hard", and 0 to 8 for "OOD Hard", with gridlines at intervals of 25%, 20%, and 2 respectively.
* **Legend (Verification Type):** Located on the top-right of the entire image.
* **None:** Represented by blue bars.
* **Binary:** Represented by orange bars.
* **Detailed:** Represented by green bars.
* **Chart Titles:** "ID Easy", "ID Hard", "OOD Hard" are titles above each respective chart.
### Detailed Analysis
**1. ID Easy Chart:**
* **None (Blue):** Accuracy starts at approximately 23% for 1M, increases to 93% for 4M, and remains at 93% for 16M.
* **Binary (Orange):** Accuracy starts at approximately 96% for 1M, increases to 98% for 4M, and remains at 98% for 16M.
* **Detailed (Green):** Accuracy starts at approximately 23% for 1M, increases to 96% for 4M, and reaches 100% for 16M.
**2. ID Hard Chart:**
* **None (Blue):** Accuracy starts at approximately 2% for 1M, increases to 37% for 4M, and reaches 65% for 16M.
* **Binary (Orange):** Accuracy starts at approximately 53% for 1M, increases to 57% for 4M, and reaches 64% for 16M.
* **Detailed (Green):** Accuracy starts at approximately 2% for 1M, increases to 43% for 4M, and reaches 66% for 16M.
**3. OOD Hard Chart:**
* **None (Blue):** Accuracy starts at approximately 1% for 1M, increases to 2% for 4M, and reaches 2% for 16M.
* **Binary (Orange):** Accuracy starts at approximately 3.7% for 1M, decreases to 3% for 4M, and decreases to 1% for 16M.
* **Detailed (Green):** Accuracy starts at approximately 1% for 1M, increases to 3% for 4M, and reaches 9% for 16M.
### Key Observations
* For "ID Easy", all verification types show high accuracy with larger model sizes (4M and 16M). Binary verification performs consistently well across all model sizes.
* For "ID Hard", accuracy generally increases with model size for all verification types. The "Detailed" verification type shows the most significant improvement.
* For "OOD Hard", the "Detailed" verification type shows the most significant improvement with increasing model size, while "None" and "Binary" verification types remain relatively low.
* The "OOD Hard" chart has a significantly smaller y-axis scale compared to the other two charts, indicating much lower accuracy in this scenario.
### Interpretation
The data suggests that model size has a positive impact on accuracy, especially for "ID Hard" and "OOD Hard" scenarios. The "Detailed" verification type appears to be the most effective in improving accuracy as model size increases, particularly for "OOD Hard" cases. The "Binary" verification type performs well in the "ID Easy" scenario, indicating it might be sufficient for simpler tasks. The "OOD Hard" scenario highlights the challenge of generalizing to out-of-distribution data, where even with larger model sizes, accuracy remains relatively low for "None" and "Binary" verification types. The "Detailed" verification type shows promise in improving accuracy for "OOD Hard" cases, suggesting it might be more robust to distributional shifts.