\n
## Charts: Language Model Performance Comparison
### Overview
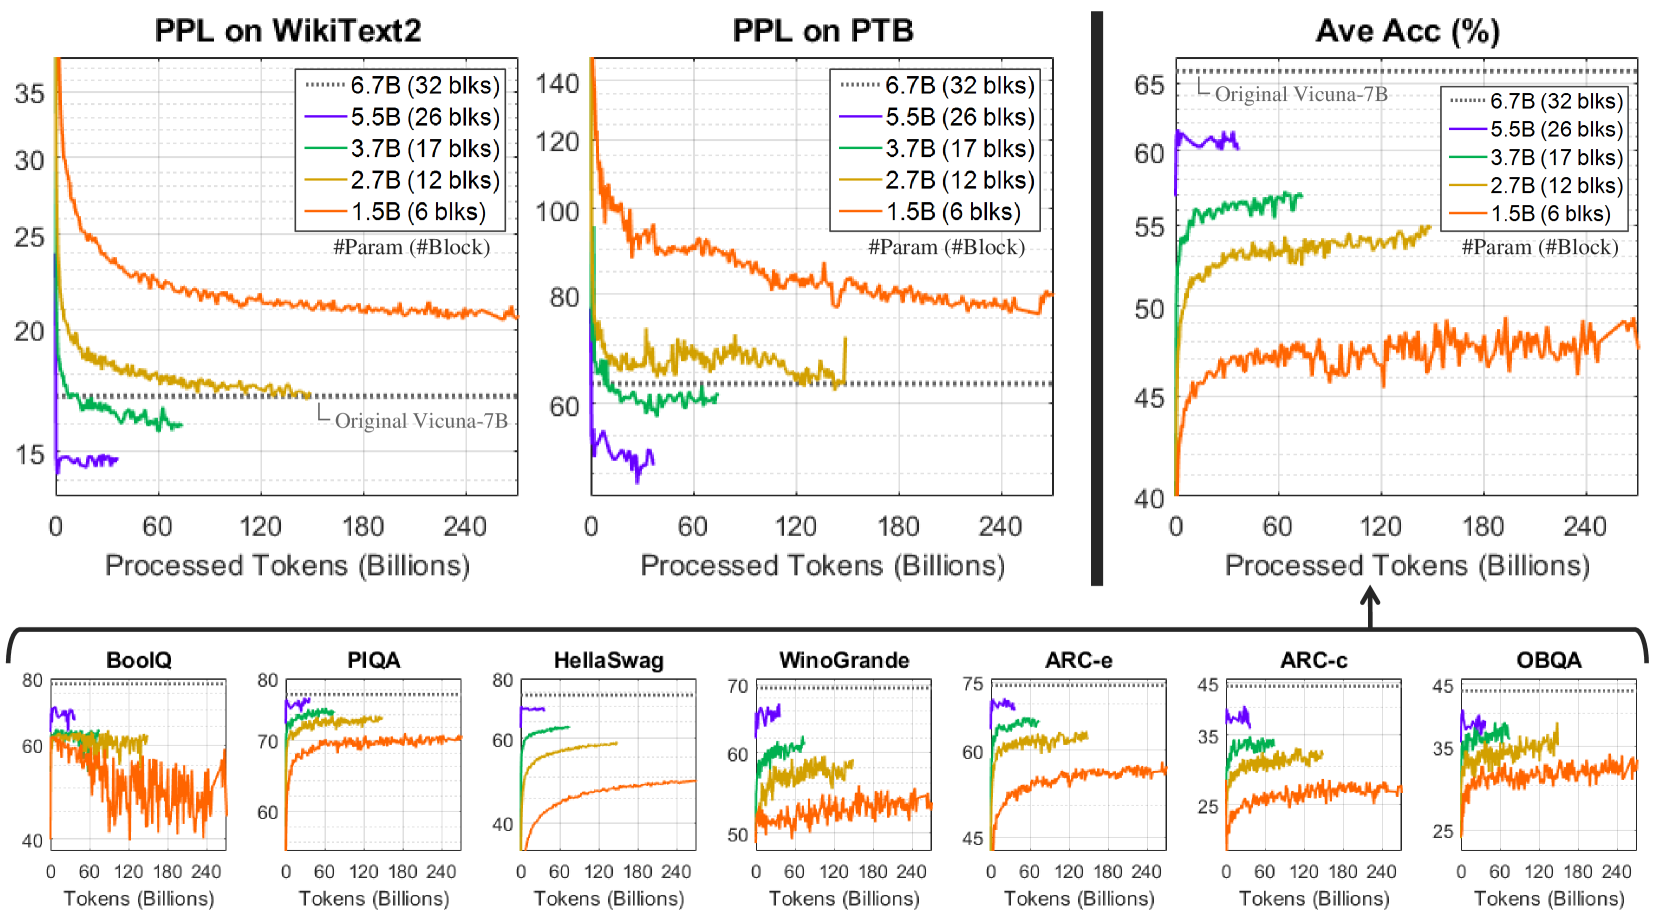
The image presents a series of line charts comparing the performance of language models with varying parameter sizes (1.5B, 2.7B, 3.7B, 5.5B, and 6.7B) across different metrics and datasets. The charts assess Perplexity (PPL) on WikiText2 and PTB datasets, Average Accuracy (Ave Acc) in percentage, and accuracy on several benchmark tasks (BoolQ, PIQA, HellaSwag, WinoGrande, ARC-c, ARC-e, OBOQA). The x-axis in all charts represents "Processed Tokens (Billions)". A baseline model, "Original Vicuna-7B", is also included for comparison.
### Components/Axes
* **X-axis (all charts):** Processed Tokens (Billions), ranging from 0 to 240.
* **Y-axis (PPL charts):** Perplexity (PPL), ranging from 15 to 35 (WikiText2) and 60 to 140 (PTB).
* **Y-axis (Ave Acc chart):** Average Accuracy (%), ranging from 40 to 65.
* **Y-axis (Benchmark charts):** Accuracy (%), ranging from 25 to 80.
* **Legend (all charts):**
* 6.7B (32 blks) - Dark Green
* 5.5B (26 blks) - Light Green
* 3.7B (17 blks) - Blue
* 2.7B (12 blks) - Orange
* 1.5B (6 blks) - Red
* Original Vicuna-7B - Purple
### Detailed Analysis or Content Details
**1. PPL on WikiText2:**
* The 6.7B model (dark green) shows the lowest perplexity, generally below 20, and remains relatively stable after 120 billion tokens.
* The 5.5B model (light green) starts slightly higher than 6.7B but converges towards a similar level after 120 billion tokens.
* The 3.7B model (blue) exhibits a decreasing trend, but remains higher than the 5.5B and 6.7B models.
* The 2.7B model (orange) shows a more pronounced decrease in perplexity, but still remains higher than the larger models.
* The 1.5B model (red) has the highest perplexity and shows a slower rate of decrease.
* Original Vicuna-7B (purple) starts at approximately 16 and remains relatively stable.
**2. PPL on PTB:**
* The 6.7B model (dark green) exhibits the lowest perplexity, fluctuating around 60-70.
* The 5.5B model (light green) follows a similar trend to the 6.7B model, with slightly higher perplexity.
* The 3.7B model (blue) shows a decreasing trend, but remains higher than the larger models.
* The 2.7B model (orange) shows a more pronounced decrease in perplexity, but still remains higher than the larger models.
* The 1.5B model (red) has the highest perplexity and shows a slower rate of decrease.
* Original Vicuna-7B (purple) starts at approximately 65 and remains relatively stable.
**3. Ave Acc (%):**
* The 6.7B model (dark green) shows the highest average accuracy, generally above 60%.
* The 5.5B model (light green) follows a similar trend to the 6.7B model, with slightly lower accuracy.
* The 3.7B model (blue) exhibits a decreasing trend, but remains lower than the 5.5B and 6.7B models.
* The 2.7B model (orange) shows a more pronounced decrease in accuracy, but still remains lower than the larger models.
* The 1.5B model (red) has the lowest accuracy and shows a slower rate of increase.
* Original Vicuna-7B (purple) starts at approximately 62 and remains relatively stable.
**4. Benchmark Tasks (BoolQ, PIQA, HellaSwag, WinoGrande, ARC-c, ARC-e, OBOQA):**
* **BoolQ:** The 6.7B model (dark green) consistently achieves the highest accuracy, followed by 5.5B (light green). The 1.5B model (red) has the lowest accuracy.
* **PIQA:** Similar trend to BoolQ, with 6.7B and 5.5B performing best.
* **HellaSwag:** The 6.7B model (dark green) shows the highest accuracy, with a relatively stable performance.
* **WinoGrande:** The 6.7B model (dark green) shows the highest accuracy, with a relatively stable performance.
* **ARC-c:** The 6.7B model (dark green) shows the highest accuracy, with a relatively stable performance.
* **ARC-e:** The 6.7B model (dark green) shows the highest accuracy, with a relatively stable performance.
* **OBOQA:** The 6.7B model (dark green) shows the highest accuracy, with a relatively stable performance.
### Key Observations
* Larger models (6.7B and 5.5B) consistently outperform smaller models across all metrics and datasets.
* The performance gap between the 6.7B and 5.5B models is relatively small, suggesting diminishing returns.
* The Original Vicuna-7B model provides a useful baseline for comparison, and the larger models generally surpass its performance.
* The benchmark tasks show similar trends, with larger models consistently achieving higher accuracy.
* The performance curves generally stabilize after approximately 120-180 billion processed tokens.
### Interpretation
The data demonstrates a clear correlation between model size and performance on various language modeling tasks. Larger models exhibit lower perplexity (better language modeling ability) and higher accuracy on benchmark tasks. This suggests that increasing the number of parameters allows the model to capture more complex patterns in the data. The diminishing returns observed between the 5.5B and 6.7B models indicate that there may be a point of saturation where further increasing model size yields only marginal improvements. The stability of the performance curves after a certain number of processed tokens suggests that the models have converged and are no longer significantly improving with additional training data. The consistent outperformance of the larger models compared to the Original Vicuna-7B model highlights the benefits of scaling up model size. The consistent trends across different benchmark tasks suggest that the observed performance improvements are generalizable and not specific to any particular dataset or task.