## [Chart Type]: Model Performance (PPL & Accuracy) Across Datasets and Model Sizes
### Overview
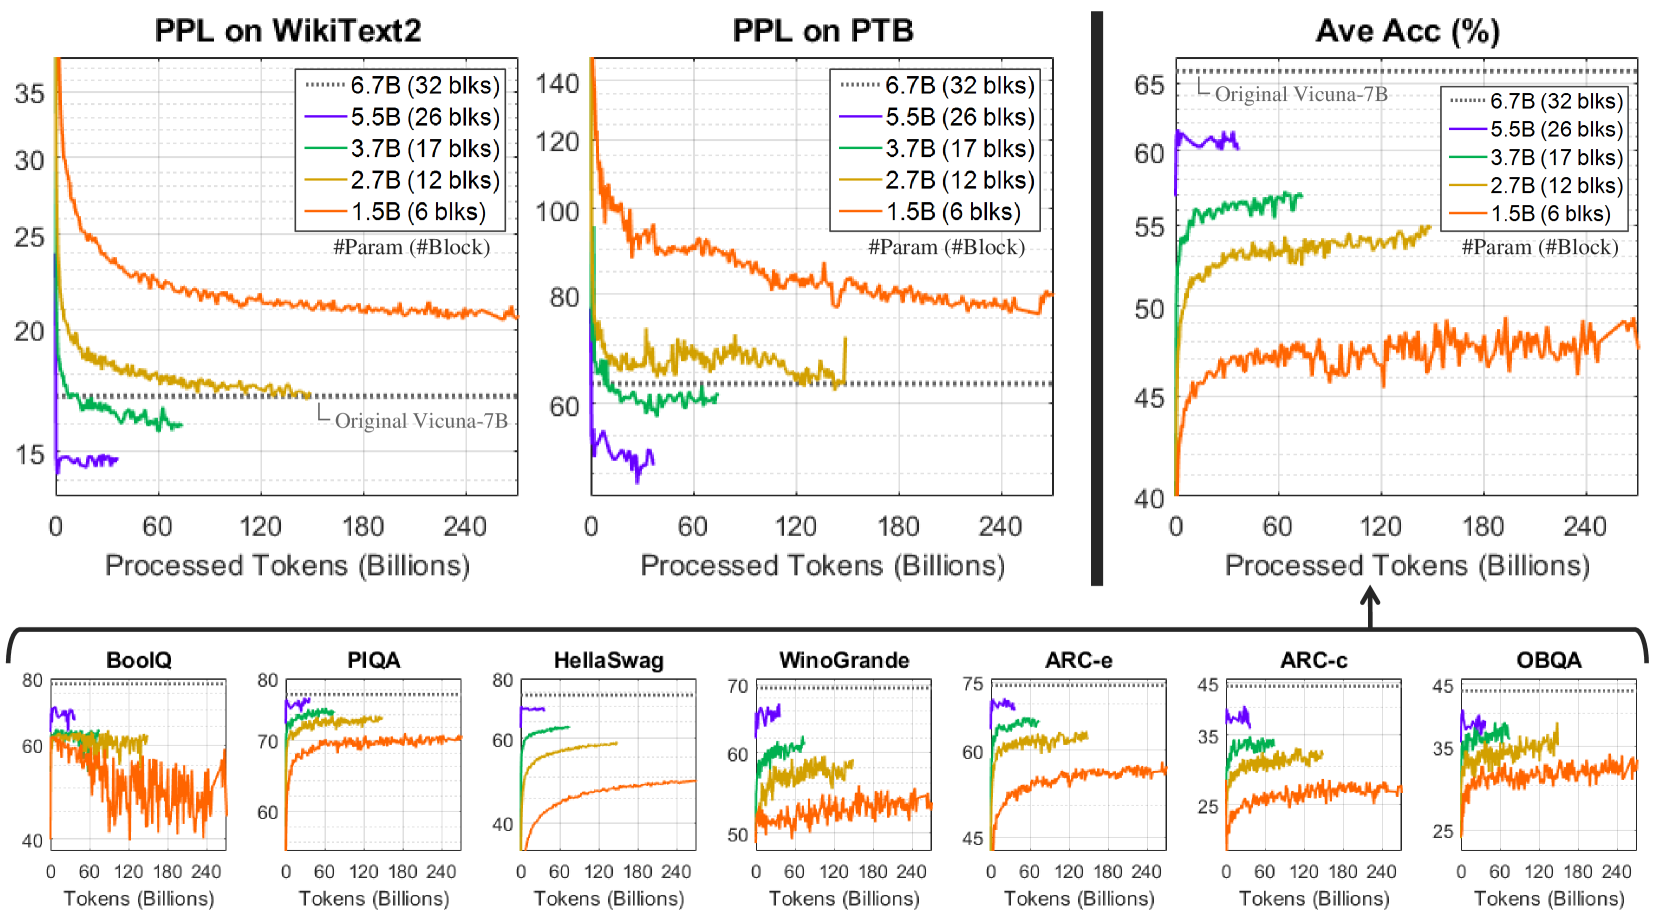
The image contains **10 line charts** (3 top, 7 bottom) analyzing model performance (Perplexity, PPL; and Accuracy) as a function of *Processed Tokens (Billions)*. Models are differentiated by parameter count (e.g., 1.5B, 2.7B, 3.7B, 5.5B, 6.7B) with color-coded lines. The “Original Vicuna-7B” (dotted line) serves as a baseline.
### Components/Axes
#### Top Charts (3):
- **Left: PPL on WikiText2**
- Y-axis: PPL (15–35, lower = better).
- X-axis: Processed Tokens (0–240 Billions).
- Legend: 6.7B (32 blks, dotted), 5.5B (26 blks, purple), 3.7B (17 blks, green), 2.7B (12 blks, yellow), 1.5B (6 blks, orange).
- Baseline: “Original Vicuna-7B” (dotted line, ~17 PPL).
- **Middle: PPL on PTB**
- Y-axis: PPL (60–140, lower = better).
- X-axis: Processed Tokens (0–240 Billions).
- Legend: Same as left.
- Baseline: “Original Vicuna-7B” (dotted line, ~60 PPL).
- **Right: Ave Acc (%)**
- Y-axis: Accuracy (40–65%, higher = better).
- X-axis: Processed Tokens (0–240 Billions).
- Legend: Same as left.
- Baseline: “Original Vicuna-7B” (dotted line, ~65%).
#### Bottom Charts (7 Datasets):
Each chart plots accuracy (Y-axis, varying ranges) vs. Processed Tokens (X-axis, 0–240 Billions). Datasets: *BoolQ, PIQA, HellaSwag, WinoGrande, ARC-e, ARC-c, OBQA*. Same model legend (colors: purple=5.5B, green=3.7B, yellow=2.7B, orange=1.5B; dotted=6.7B).
### Detailed Analysis
#### Top Left: PPL on WikiText2
- **Trend:** All models show *decreasing PPL* (improved performance) with more tokens.
- 1.5B (orange): Starts ~35, drops to ~20 (240B tokens).
- 2.7B (yellow): Starts ~25, drops to ~17.
- 3.7B (green): Starts ~20, drops to ~16.
- 5.5B (purple): Starts ~15, remains flat (~15).
- 6.7B (dotted): Flat at ~17 (matches “Original Vicuna-7B”).
#### Top Middle: PPL on PTB
- **Trend:** Similar to WikiText2, but *higher PPL* (PTB is a harder dataset).
- 1.5B (orange): Starts ~140, drops to ~80.
- 2.7B (yellow): Starts ~100, drops to ~70.
- 3.7B (green): Starts ~80, drops to ~60.
- 5.5B (purple): Starts ~60, drops to ~50.
- 6.7B (dotted): Flat at ~60 (matches “Original Vicuna-7B”).
#### Top Right: Ave Acc (%)
- **Trend:** All models show *increasing accuracy* with more tokens.
- 1.5B (orange): Starts ~40, rises to ~50.
- 2.7B (yellow): Starts ~50, rises to ~55.
- 3.7B (green): Starts ~55, rises to ~57.
- 5.5B (purple): Starts ~60, rises to ~62.
- 6.7B (dotted): Flat at ~65 (matches “Original Vicuna-7B”).
#### Bottom Charts (7 Datasets)
- **BoolQ:** Y-axis (40–80). 1.5B (orange) has high variance; others (purple, green, yellow) are stable. All increase with tokens.
- **PIQA:** Y-axis (60–80). 1.5B (orange) starts ~60, rises to ~70. Larger models (purple, green, yellow) start ~70–80 (stable).
- **HellaSwag:** Y-axis (40–80). 1.5B (orange) starts ~40, rises to ~50. Larger models start ~60–70 (stable).
- **WinoGrande:** Y-axis (50–70). 1.5B (orange) starts ~50, rises to ~55. Larger models start ~60–65 (stable).
- **ARC-e:** Y-axis (45–75). 1.5B (orange) starts ~45, rises to ~55. Larger models start ~60–70 (stable).
- **ARC-c:** Y-axis (25–45). 1.5B (orange) starts ~25, rises to ~35. Larger models start ~35–40 (stable).
- **OBQA:** Y-axis (25–45). 1.5B (orange) starts ~25, rises to ~35. Larger models start ~35–40 (stable).
### Key Observations
1. **Model Size vs. Performance:** Larger models (more parameters) have *better initial performance* (lower PPL, higher accuracy) and improve more consistently with tokens.
2. **Dataset Difficulty:** PPL on PTB is higher than WikiText2, indicating PTB is a harder language modeling dataset.
3. **Training Progress:** All models show improvement (lower PPL, higher accuracy) with more tokens, confirming continued learning.
4. **Baseline Comparison:** “Original Vicuna-7B” (dotted line) is matched/exceeded by larger models (6.7B) and smaller models with more tokens.
### Interpretation
The charts illustrate the critical role of **model size** (parameter count) and **training tokens** in improving language modeling (PPL) and question-answering/reading comprehension (accuracy). Larger models (e.g., 6.7B) outperform smaller ones (e.g., 1.5B) initially and maintain stability, while smaller models require more tokens to approach baseline performance. This suggests:
- Scaling model size (parameters) and training data (tokens) are complementary strategies for performance gains.
- Diminishing returns exist for very large models (e.g., 5.5B and 6.7B have similar trends).
- Smaller models (1.5B) are less stable (high variance) but still benefit from more training.
These insights guide decisions on model architecture and training duration for real-world NLP tasks.