## Line Graphs: Model Performance Across Tasks
### Overview
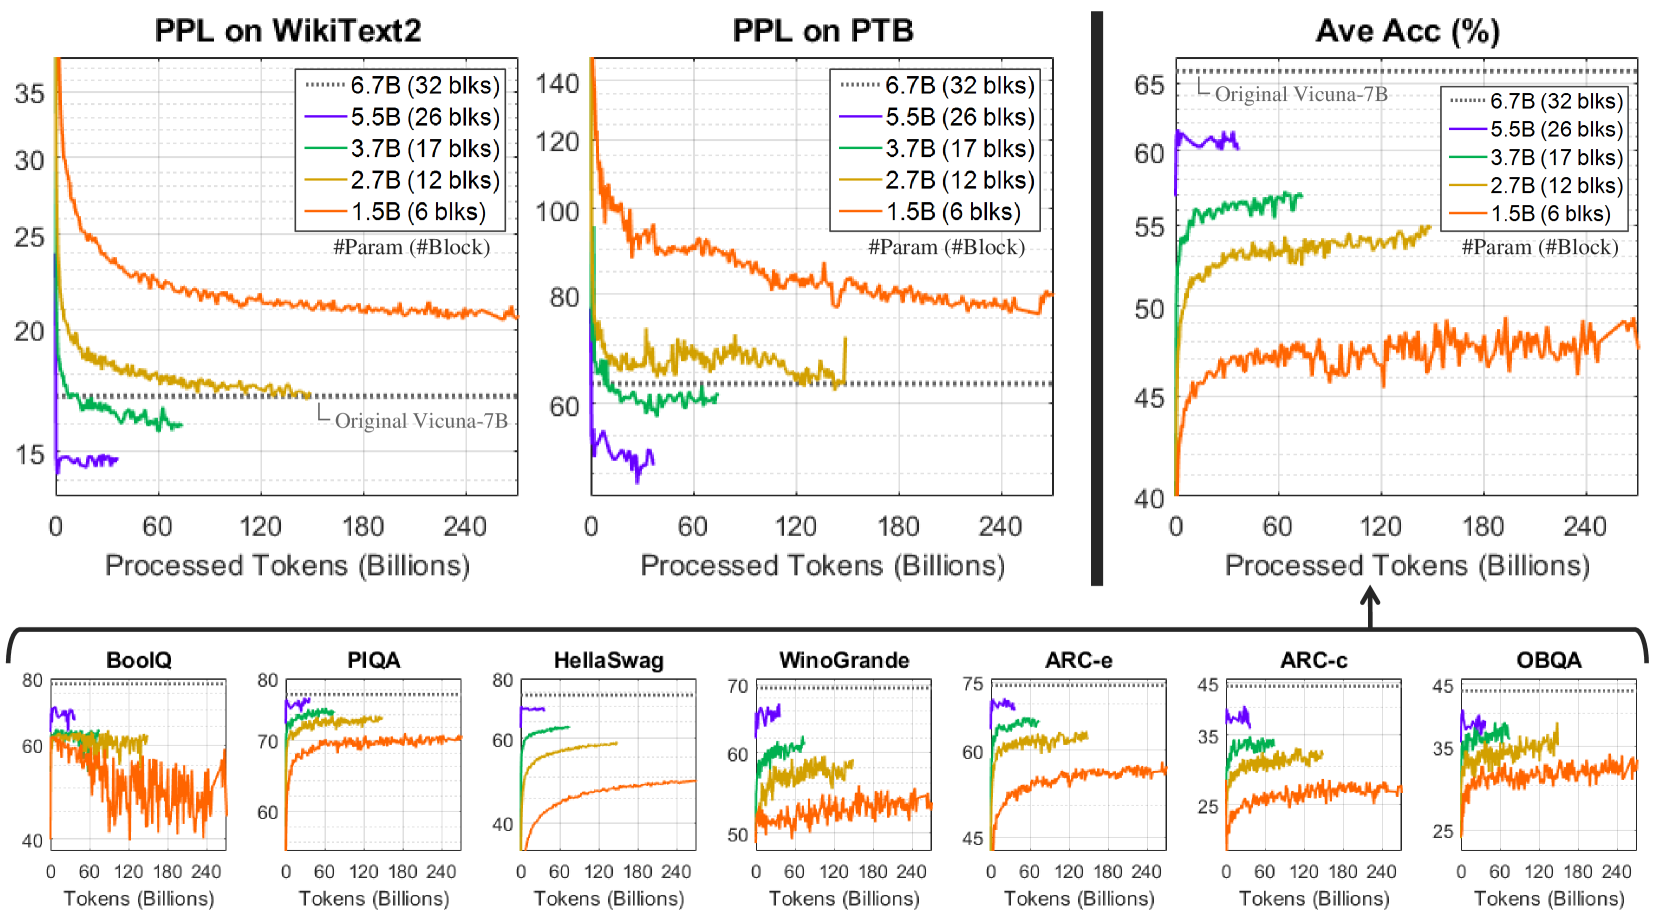
The image contains multiple line graphs comparing the performance of different language models (LMs) on various natural language processing (NLP) tasks. The graphs track metrics like **Perplexity (PPL)** and **Accuracy (Ave Acc)** as a function of **Processed Tokens (Billions)**. Models are differentiated by size (e.g., 6.7B, 5.5B) and block counts (e.g., 32 blks, 6 blks), with the "Original Vicuna-7B" serving as a reference benchmark.
---
### Components/Axes
1. **Main Graphs (Top Section)**:
- **X-axis**: Processed Tokens (Billions) – Linear scale from 0 to 240.
- **Y-axes**:
- **PPL on WikiText2/PTB**: Perplexity (lower = better).
- **Ave Acc (%)**: Accuracy percentage (higher = better).
- **Legends**:
- Model sizes and block counts (e.g., "6.7B (32 blks)" in purple, "1.5B (6 blks)" in red).
- "Original Vicuna-7B" (dotted gray line) as a reference.
2. **Smaller Graphs (Bottom Section)**:
- Tasks: BoolQ, PIQA, HellaSwag, Winogrande, ARC-e, ARC-c, OBQA.
- X-axis: Tokens (Billions) – Linear scale from 0 to 240.
- Y-axes: Task-specific metrics (e.g., accuracy for BoolQ, PPL for PIQA).
---
### Detailed Analysis
#### PPL on WikiText2
- **Trend**: All models show decreasing PPL as tokens increase. Larger models (6.7B, 5.5B) start with lower PPL and maintain a lead. Smaller models (1.5B) begin with higher PPL but improve more steeply.
- **Key Data Points**:
- 6.7B (32 blks): Starts at ~15 PPL, stabilizes near 10 by 240B tokens.
- 1.5B (6 blks): Starts at ~35 PPL, drops to ~20 by 240B tokens.
- **Legend Match**: Purple (6.7B) line is consistently lowest; red (1.5B) line is highest.
#### PPL on PTB
- **Trend**: Similar to WikiText2, but with higher initial PPL values. The 6.7B model starts at ~140 PPL, while the 1.5B model starts at ~120 PPL.
- **Key Data Points**:
- 6.7B (32 blks): Drops to ~80 PPL by 240B tokens.
- 1.5B (6 blks): Drops to ~60 PPL by 240B tokens.
- **Legend Match**: Purple (6.7B) line is lowest; red (1.5B) line is highest.
#### Ave Acc (%)
- **Trend**: Larger models start with higher accuracy but show slower improvement. Smaller models (1.5B) start lower but improve more sharply.
- **Key Data Points**:
- 6.7B (32 blks): Starts at ~60%, rises to ~65%.
- 1.5B (6 blks): Starts at ~45%, rises to ~55%.
- **Legend Match**: Purple (6.7B) line is highest; red (1.5B) line is lowest initially but catches up.
#### Smaller Task Graphs
- **BoolQ**:
- 6.7B (32 blks) starts at ~80%, drops to ~60%.
- 1.5B (6 blks) starts at ~60%, drops to ~40%.
- **PIQA**:
- 6.7B (32 blks) starts at ~70%, stabilizes near 65%.
- 1.5B (6 blks) starts at ~60%, stabilizes near 55%.
- **HellaSwag**:
- 6.7B (32 blks) starts at ~80%, drops to ~60%.
- 1.5B (6 blks) starts at ~60%, drops to ~40%.
- **Winogrande**:
- 6.7B (32 blks) starts at ~70%, drops to ~50%.
- 1.5B (6 blks) starts at ~50%, drops to ~40%.
- **ARC-e/ARC-c/OBQA**:
- 6.7B (32 blks) starts highest (~75% for ARC-e) but plateaus.
- 1.5B (6 blks) starts lower (~45% for ARC-e) but improves to ~55%.
---
### Key Observations
1. **Model Size vs. Performance**:
- Larger models (6.7B) generally outperform smaller ones initially but show diminishing returns as tokens increase.
- Smaller models (1.5B) improve more significantly over time, suggesting better adaptability or efficiency in certain tasks.
2. **Task-Specific Behavior**:
- **PPL Tasks (WikiText2/PTB)**: Larger models maintain lower PPL, but smaller models close the gap.
- **Accuracy Tasks (Ave Acc, BoolQ, etc.)**: Smaller models often catch up or surpass larger ones in later stages, indicating task-dependent scaling laws.
3. **Original Vicuna-7B Benchmark**:
- The dotted gray line (Original Vicuna-7B) serves as a reference. Most models outperform it in PPL but underperform in accuracy tasks.
---
### Interpretation
The data highlights a trade-off between model size and performance:
- **Larger models** excel in initial performance (lower PPL, higher accuracy) but may plateau as tokens increase.
- **Smaller models** show greater improvement over time, suggesting they may be more efficient or better suited for specific tasks.
- The **Original Vicuna-7B** acts as a baseline, with most models surpassing it in PPL but lagging in accuracy tasks. This implies that architectural or training differences (e.g., block counts) may influence task-specific outcomes.
The graphs underscore the importance of model architecture and training data in determining performance across diverse NLP tasks.