## Tree Diagram: Hierarchical Node Network
### Overview
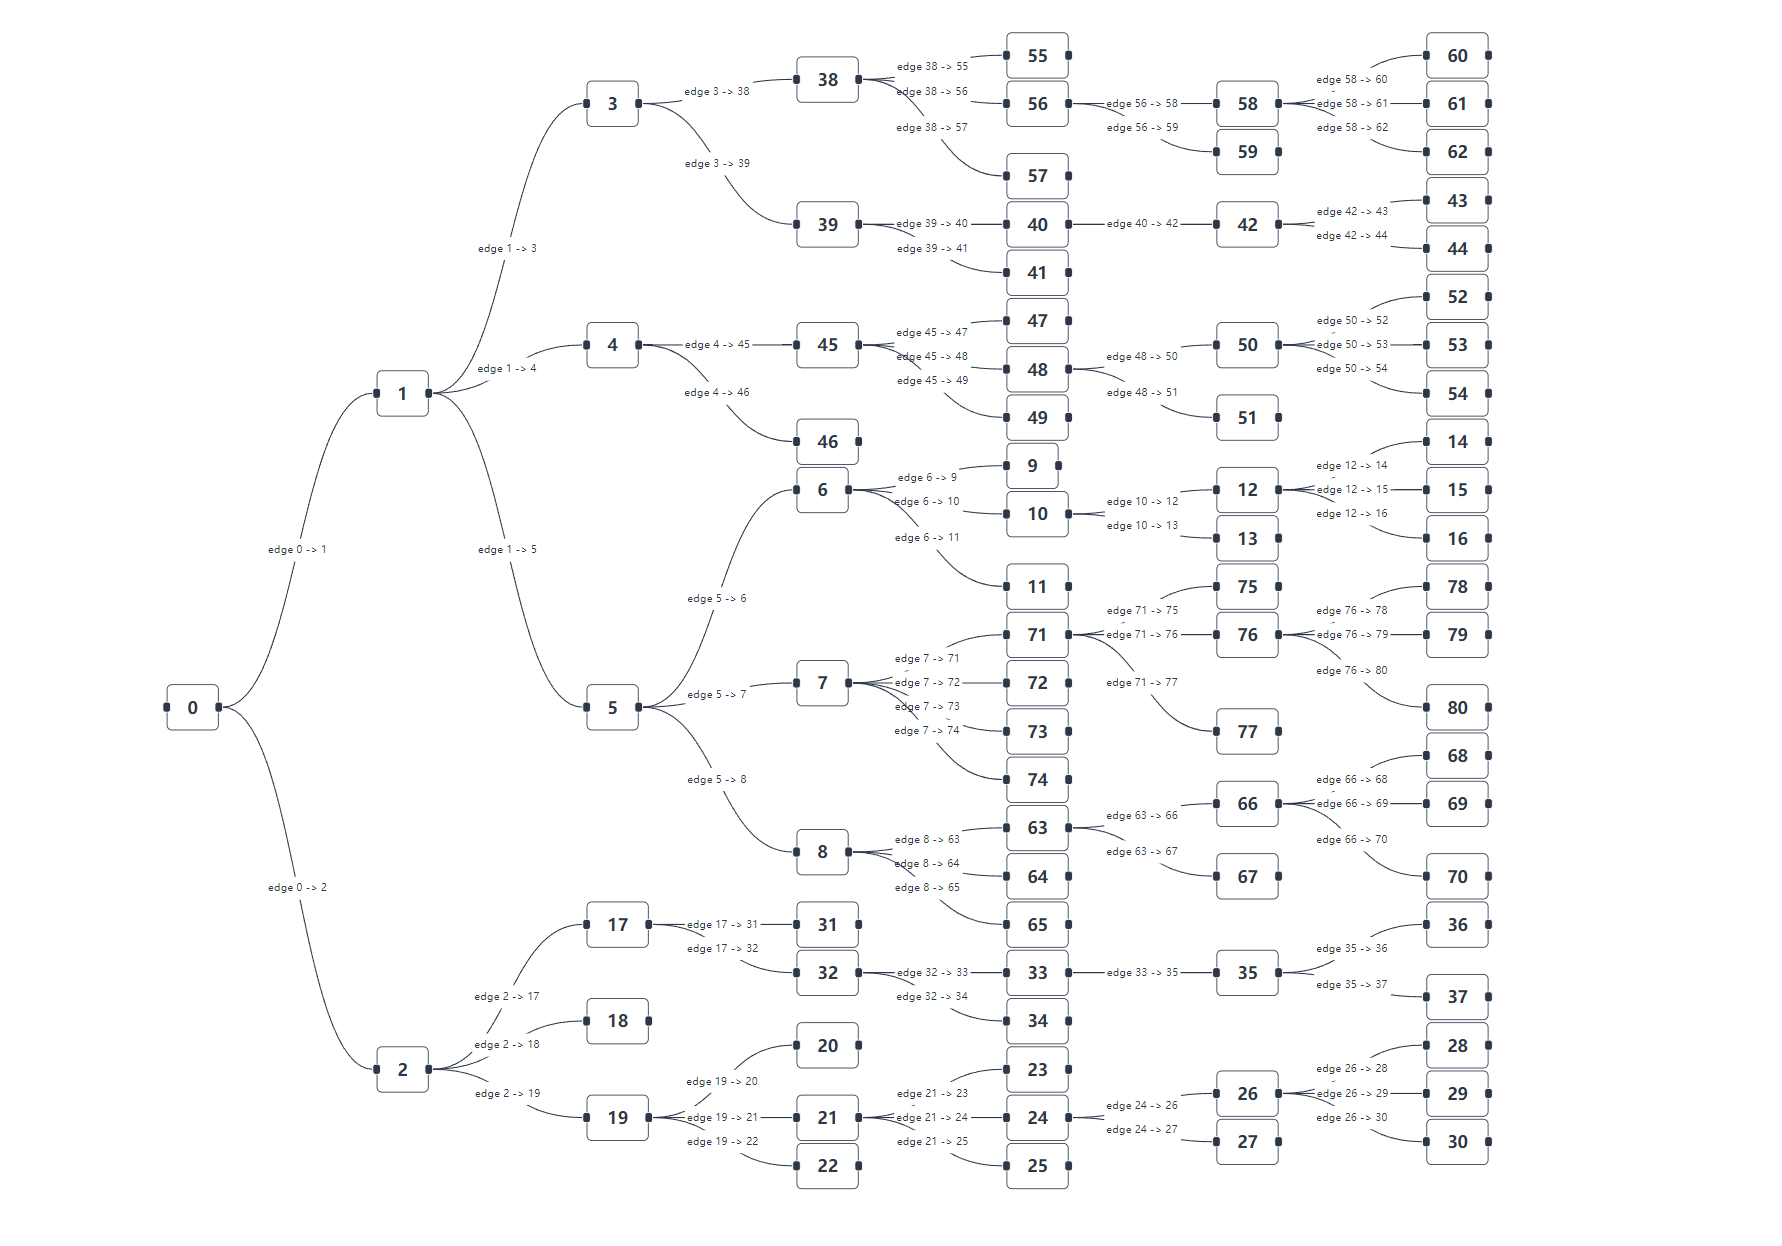
The image depicts a tree diagram illustrating a hierarchical network of nodes, numbered from 0 to 80. The diagram shows connections between nodes, with edges labeled to indicate the direction of the relationship. The diagram appears to represent a flow or dependency structure.
### Components/Axes
* **Nodes:** Represented as rounded rectangles, each containing a unique numerical identifier (0-80).
* **Edges:** Represented as curved lines connecting the nodes, indicating relationships or flow. Each edge is labeled with the format "edge X -> Y", where X and Y are the numerical identifiers of the connected nodes.
* **Layout:** The diagram is structured hierarchically, with node 0 at the root and subsequent nodes branching out.
### Detailed Analysis or ### Content Details
* **Root Node:** Node 0 is the root, with edges leading to nodes 1 and 2.
* `edge 0 -> 1`
* `edge 0 -> 2`
* **Level 1 Nodes:** Nodes 1 and 2 branch out from node 0.
* Node 1 has edges leading to nodes 3, 4, and 5.
* `edge 1 -> 3`
* `edge 1 -> 4`
* `edge 1 -> 5`
* Node 2 has edges leading to nodes 17, 18, and 19.
* `edge 2 -> 17`
* `edge 2 -> 18`
* `edge 2 -> 19`
* **Level 2 Nodes (Examples):**
* Node 3 has edges leading to nodes 38 and 39.
* `edge 3 -> 38`
* `edge 3 -> 39`
* Node 4 has edges leading to nodes 45 and 46.
* `edge 4 -> 45`
* `edge 4 -> 46`
* Node 5 has edges leading to nodes 6, 7, and 8.
* `edge 5 -> 6`
* `edge 5 -> 7`
* `edge 5 -> 8`
* Node 19 has edges leading to nodes 20, 21, and 22.
* `edge 19 -> 20`
* `edge 19 -> 21`
* `edge 19 -> 22`
* **Deeper Levels:** The diagram continues to branch out, with nodes at deeper levels having their own connections. For example:
* Node 38 has edges leading to nodes 55, 56, and 57.
* `edge 38 -> 55`
* `edge 38 -> 56`
* `edge 38 -> 57`
* Node 56 has edges leading to nodes 58 and 59.
* `edge 56 -> 58`
* `edge 56 -> 59`
* Node 58 has edges leading to nodes 60, 61, and 62.
* `edge 58 -> 60`
* `edge 58 -> 61`
* `edge 58 -> 62`
* Node 71 has edges leading to nodes 75 and 76.
* `edge 71 -> 75`
* `edge 71 -> 76`
* `edge 71 -> 77`
* Node 76 has edges leading to nodes 78, 79, and 80.
* `edge 76 -> 78`
* `edge 76 -> 79`
* `edge 76 -> 80`
* **Leaf Nodes:** Some nodes do not have outgoing edges, indicating they are leaf nodes in the tree. Examples include nodes 9, 11, 14, 15, 16, 20, 22, 23, 25, 27, 28, 29, 30, 31, 34, 36, 37, 39, 40, 41, 43, 44, 47, 49, 51, 52, 53, 54, 55, 57, 59, 60, 61, 62, 64, 65, 67, 68, 69, 70, 72, 73, 74, 75, 77, 78, 79, 80.
### Key Observations
* The diagram represents a directed acyclic graph (DAG) structure.
* The branching factor varies across different nodes. Some nodes have multiple outgoing edges, while others have only one or none.
* The node numbering appears to be somewhat sequential but not strictly linear, suggesting a specific order or relationship between the nodes.
### Interpretation
The tree diagram likely represents a hierarchical relationship or a flow of information/processes. The edges indicate dependencies or transitions between the nodes. The specific meaning of the nodes and edges would depend on the context in which this diagram is used. For example, it could represent a decision tree, a process flow, or a dependency graph in a software system. The diagram provides a visual representation of the structure and relationships within the system, allowing for easier understanding and analysis.