## Line Chart: Speedup over CoT vs. Chunk Size
### Overview
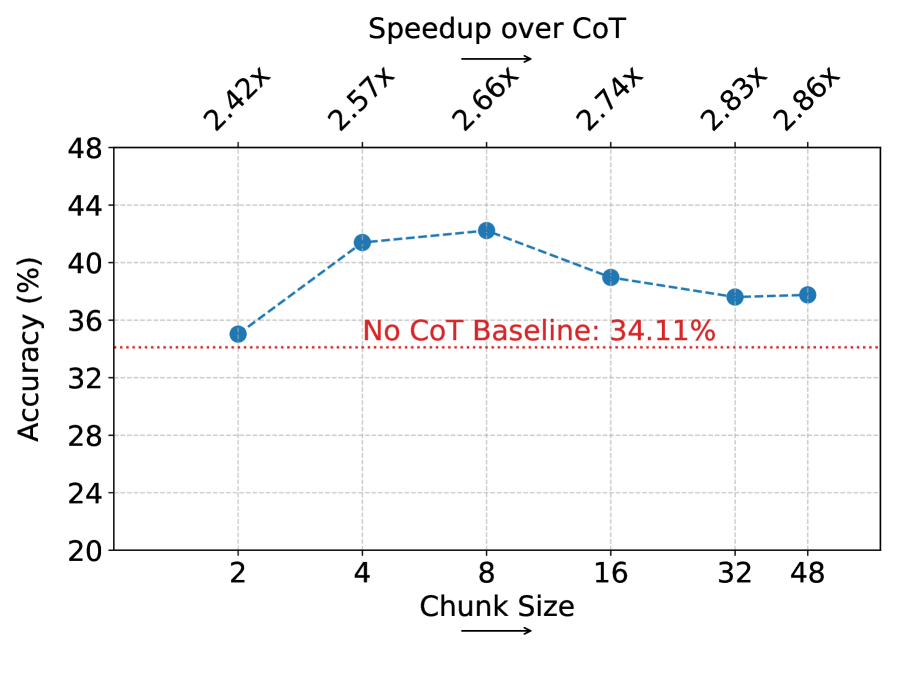
This image is a line chart titled "Speedup over CoT" that plots the accuracy (in percentage) of a method against different "Chunk Size" values. It includes a baseline comparison and annotations showing the speedup factor for each chunk size relative to a Chain-of-Thought (CoT) baseline.
### Components/Axes
* **Title:** "Speedup over CoT" (centered at the top).
* **X-Axis:** Labeled "Chunk Size" with an arrow pointing right. The axis has categorical tick marks at values: **2, 4, 8, 16, 32, 48**.
* **Y-Axis:** Labeled "Accuracy (%)" with a scale from **20 to 48**, in increments of 4 (20, 24, 28, 32, 36, 40, 44, 48).
* **Data Series:** A single blue dashed line with circular markers representing the accuracy for each chunk size.
* **Baseline:** A red dotted horizontal line at **34.11%** on the y-axis, labeled "No CoT Baseline: 34.11%" in red text, positioned just above the line in the center of the chart.
* **Annotations:** Above each data point on the blue line, a speedup factor is written at an angle (e.g., "2.42x"). These values increase from left to right.
### Detailed Analysis
The chart displays the following data points (approximate values read from the y-axis):
| Chunk Size | Approximate Accuracy (%) | Speedup Factor (over CoT) |
| :--- | :--- | :--- |
| 2 | ~35.0 | 2.42x |
| 4 | ~41.5 | 2.57x |
| 8 | ~42.0 | 2.66x |
| 16 | ~39.0 | 2.74x |
| 32 | ~37.5 | 2.83x |
| 48 | ~37.8 | 2.86x |
**Trend Verification:**
* **Accuracy Trend (Blue Line):** The line starts at ~35% for chunk size 2, rises sharply to a peak of ~42% at chunk size 8, then gradually declines to ~37.8% at chunk size 48. The overall trend is an initial increase followed by a gradual decrease.
* **Speedup Trend (Annotations):** The speedup factor shows a consistent, monotonic increase from 2.42x to 2.86x as chunk size increases from 2 to 48.
### Key Observations
1. **Peak Performance:** The highest accuracy (~42%) is achieved at a chunk size of 8.
2. **Baseline Comparison:** All tested chunk sizes yield accuracy values above the "No CoT Baseline" of 34.11%.
3. **Diverging Trends:** Accuracy and speedup do not correlate perfectly. While speedup improves steadily with larger chunk sizes, accuracy peaks at an intermediate size (8) and then diminishes.
4. **Diminishing Returns:** After chunk size 8, increasing the chunk size further leads to a decrease in accuracy, despite continued gains in speedup.
### Interpretation
The data demonstrates a trade-off between computational efficiency (speedup) and model performance (accuracy) when using chunked processing compared to a standard Chain-of-Thought (CoT) approach.
* **What it suggests:** The method being tested is consistently faster than the CoT baseline (all speedups >2.4x) and also more accurate (all points above the red baseline). This indicates a successful optimization.
* **Relationship between elements:** The "Chunk Size" parameter controls this trade-off. Smaller chunks (2) offer the least speedup but still beat the baseline. An optimal balance appears at chunk size 8, maximizing accuracy. Larger chunks (16-48) prioritize speed, yielding the highest speedups but at the cost of some accuracy loss from the peak.
* **Notable anomaly:** The accuracy does not plateau but actively decreases after the peak at chunk size 8. This suggests that beyond a certain point, the chunking strategy may introduce errors or lose context, negatively impacting performance despite faster processing.
* **Practical implication:** For applications where accuracy is paramount, a chunk size around 8 is ideal. For latency-sensitive tasks where a small accuracy drop is acceptable, larger chunk sizes (32 or 48) provide the greatest speed advantage.