# Technical Document Analysis of Chart
## Chart Overview
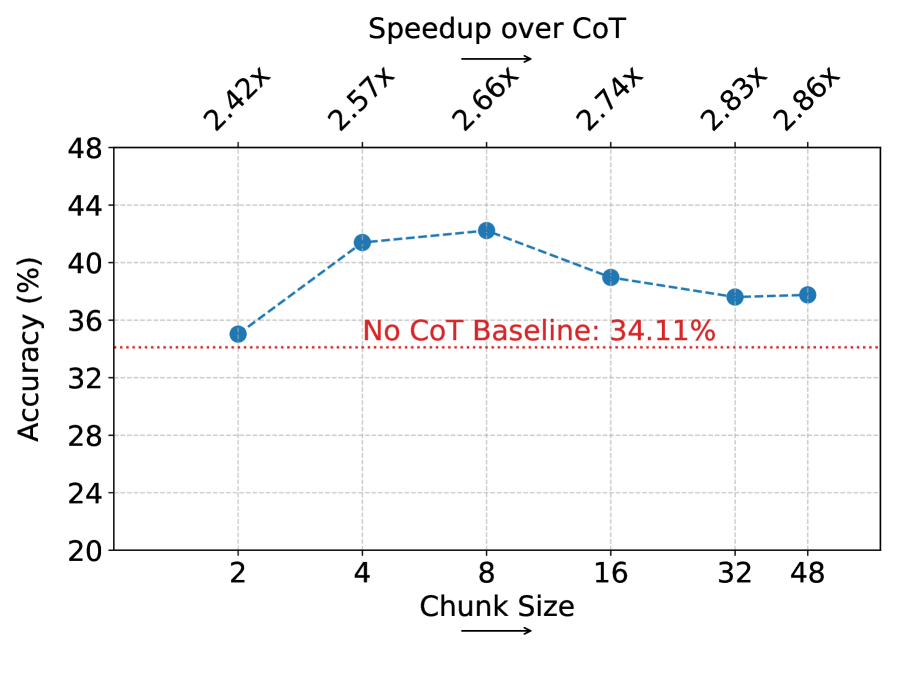
The image depicts a line chart titled **"Speedup over CoT"**, comparing accuracy percentages across varying chunk sizes. The chart includes a baseline reference line and annotated speedup factors.
---
### **Key Components**
1. **Axes**
- **X-axis (Horizontal):**
- Label: **"Chunk Size"**
- Values: `2`, `4`, `8`, `16`, `32`, `48`
- Direction: Left to right (increasing chunk size).
- **Y-axis (Vertical):**
- Label: **"Accuracy (%)"**
- Range: `20` to `48` (increments of `4`).
2. **Legend**
- Located at the **top-right corner**.
- **Blue dashed line:** `"Speedup over CoT"` (matches the primary data series).
- **Red dotted line:** `"No CoT Baseline: 34.11%"` (constant reference line).
3. **Data Series**
- **Blue dashed line (Speedup over CoT):**
- Data points plotted at each chunk size with corresponding accuracy percentages.
- Speedup factors annotated above each chunk size:
- `2.42x` (chunk size 2), `2.57x` (4), `2.66x` (8), `2.74x` (16), `2.83x` (32), `2.86x` (48).
- **Red dotted line (Baseline):**
- Constant value at `34.11%` accuracy.
---
### **Trends and Data Points**
1. **Blue Dashed Line (Speedup over CoT):**
- **Visual Trend:**
- Slopes upward from chunk size `2` to `8`, then slopes downward from `8` to `48`.
- **Data Points (Accuracy %):**
- Chunk Size `2`: `35.2%`
- Chunk Size `4`: `41.2%`
- Chunk Size `8`: `42.1%`
- Chunk Size `16`: `38.9%`
- Chunk Size `32`: `37.5%`
- Chunk Size `48`: `37.8%`
2. **Red Dotted Line (No CoT Baseline):**
- **Visual Trend:**
- Horizontal line at `34.11%` accuracy across all chunk sizes.
---
### **Annotations**
- **Title:** `"Speedup over CoT"` (centered at the top).
- **Baseline Label:** `"No CoT Baseline: 34.11%"` (red dotted line).
- **Speedup Factors:**
- Annotated above each chunk size on the x-axis (e.g., `2.42x` at chunk size `2`).
---
### **Spatial Grounding**
- **Legend Position:** Top-right corner.
- **Data Point Colors:**
- Blue (`#0000FF`) for the "Speedup over CoT" series.
- Red (`#FF0000`) for the baseline.
---
### **Summary**
The chart illustrates how accuracy improves with increasing chunk sizes up to a point (chunk size `8`), after which it declines. The maximum accuracy (`42.1%`) is achieved at chunk size `8`, with a speedup factor of `2.66x` over the baseline. The baseline accuracy remains constant at `34.11%` across all chunk sizes.