## Directed Graph Diagram: Node Interactions
### Overview
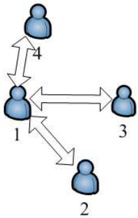
The image depicts a directed graph with four nodes (labeled 1–4) and five directed edges. Nodes are represented as blue human-like icons, and edges are unidirectional arrows. The graph exhibits cyclic and acyclic pathways, with bidirectional connectivity between nodes 1 and 3.
### Components/Axes
- **Nodes**:
- Node 1 (top-left)
- Node 2 (bottom-left)
- Node 3 (top-right)
- Node 4 (bottom-right)
- **Edges**:
- 1 → 2 (solid arrow)
- 1 → 3 (solid arrow)
- 2 → 4 (solid arrow)
- 3 → 1 (solid arrow)
- 4 → 1 (solid arrow)
- **Bidirectional Edge**:
- Between nodes 1 and 3 (double-headed arrow)
### Detailed Analysis
- **Node 1** acts as a central hub, receiving input from nodes 3 and 4 while distributing output to nodes 2 and 3.
- **Node 2** only interacts with node 4 (outgoing) and node 1 (incoming).
- **Node 3** forms a feedback loop with node 1 via bidirectional connectivity.
- **Node 4** feeds back into node 1, creating a dependency cycle (1 → 2 → 4 → 1).
### Key Observations
1. **Centrality of Node 1**: It is the only node with both incoming and outgoing edges to three other nodes.
2. **Bidirectional Relationship**: The unique bidirectional edge between nodes 1 and 3 suggests mutual interaction or synchronization.
3. **Cyclic Pathways**: Two distinct cycles exist:
- Short cycle: 1 ↔ 3
- Longer cycle: 1 → 2 → 4 → 1
### Interpretation
This diagram likely represents a system with feedback loops and dependencies. Node 1’s central role implies it may act as a coordinator or processor, while nodes 2 and 4 depend on it for input. The bidirectional link between 1 and 3 could indicate a partnership or shared resource. The absence of external inputs/outputs suggests a closed-loop system, where all interactions occur internally. The structure highlights potential bottlenecks (e.g., node 1’s dual role) and resilience (e.g., redundant pathways to node 1).