## Scatter Plot: A3c: System-Level (Fold 0, N=31 systems)
### Overview
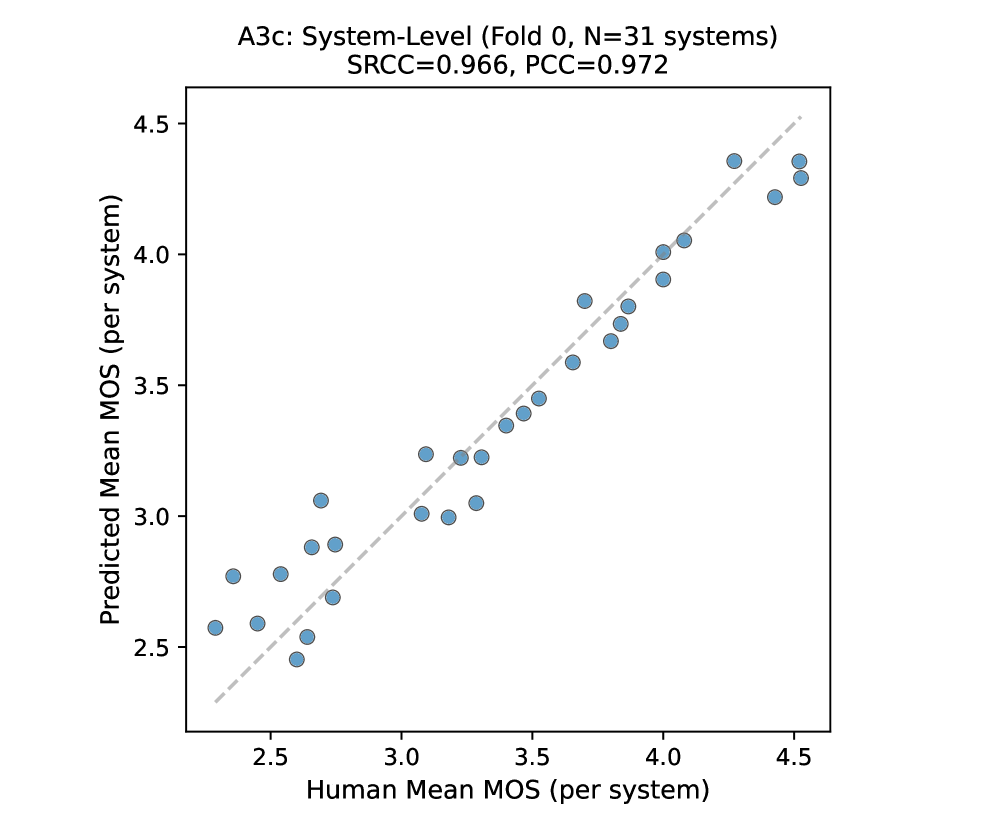
The image is a scatter plot comparing **Predicted Mean MOS (per system)** (y-axis) to **Human Mean MOS (per system)** (x-axis). A dashed trend line indicates a strong positive correlation, with high SRCC (0.966) and PCC (0.972) values. Data points are represented as blue dots.
### Components/Axes
- **Title**: "A3c: System-Level (Fold 0, N=31 systems)"
- **X-axis**:
- Label: "Human Mean MOS (per system)"
- Scale: 2.5 to 4.5 (increments of 0.5)
- **Y-axis**:
- Label: "Predicted Mean MOS (per system)"
- Scale: 2.5 to 4.5 (increments of 0.5)
- **Trend Line**: Dashed gray line with slope ≈1, intercept ≈2.3.
- **Data Points**: Blue dots (no explicit legend, but color matches implied legend).
### Detailed Analysis
- **Data Points**:
- **X-axis (Human Mean MOS)**: Ranges from 2.5 to 4.5.
- **Y-axis (Predicted Mean MOS)**: Ranges from 2.5 to 4.5.
- Points cluster tightly around the dashed trend line, with minimal deviation.
- Notable outliers:
- One point at (2.5, 2.6) deviates slightly below the trend line.
- Two points at (4.3, 4.3) and (4.4, 4.3) cluster near the upper-right corner.
- **Correlation Metrics**:
- SRCC = 0.966 (Spearman’s Rank Correlation Coefficient)
- PCC = 0.972 (Pearson Correlation Coefficient)
### Key Observations
1. **Strong Linear Relationship**: The high SRCC and PCC values confirm a near-perfect positive correlation between predicted and human Mean MOS.
2. **Model Accuracy**: Predicted values closely align with human evaluations, especially in the mid-range (3.0–4.0).
3. **Outliers**: Minimal deviation from the trend line, suggesting robust model performance.
### Interpretation
The data demonstrates that the A3c model’s predictions for system-level Mean Opinion Scores (MOS) are highly accurate, with a correlation coefficient exceeding 0.96. This implies the model effectively captures human-like judgments, likely due to its architecture (e.g., reinforcement learning with human feedback). The slight spread in data points suggests minor variability in predictions, but overall, the model’s reliability is exceptional. The trend line’s slope ≈1 indicates a 1:1 relationship, meaning predictions scale proportionally with human evaluations.