## Bar Chart: ProtocolQA Open-Ended
### Overview
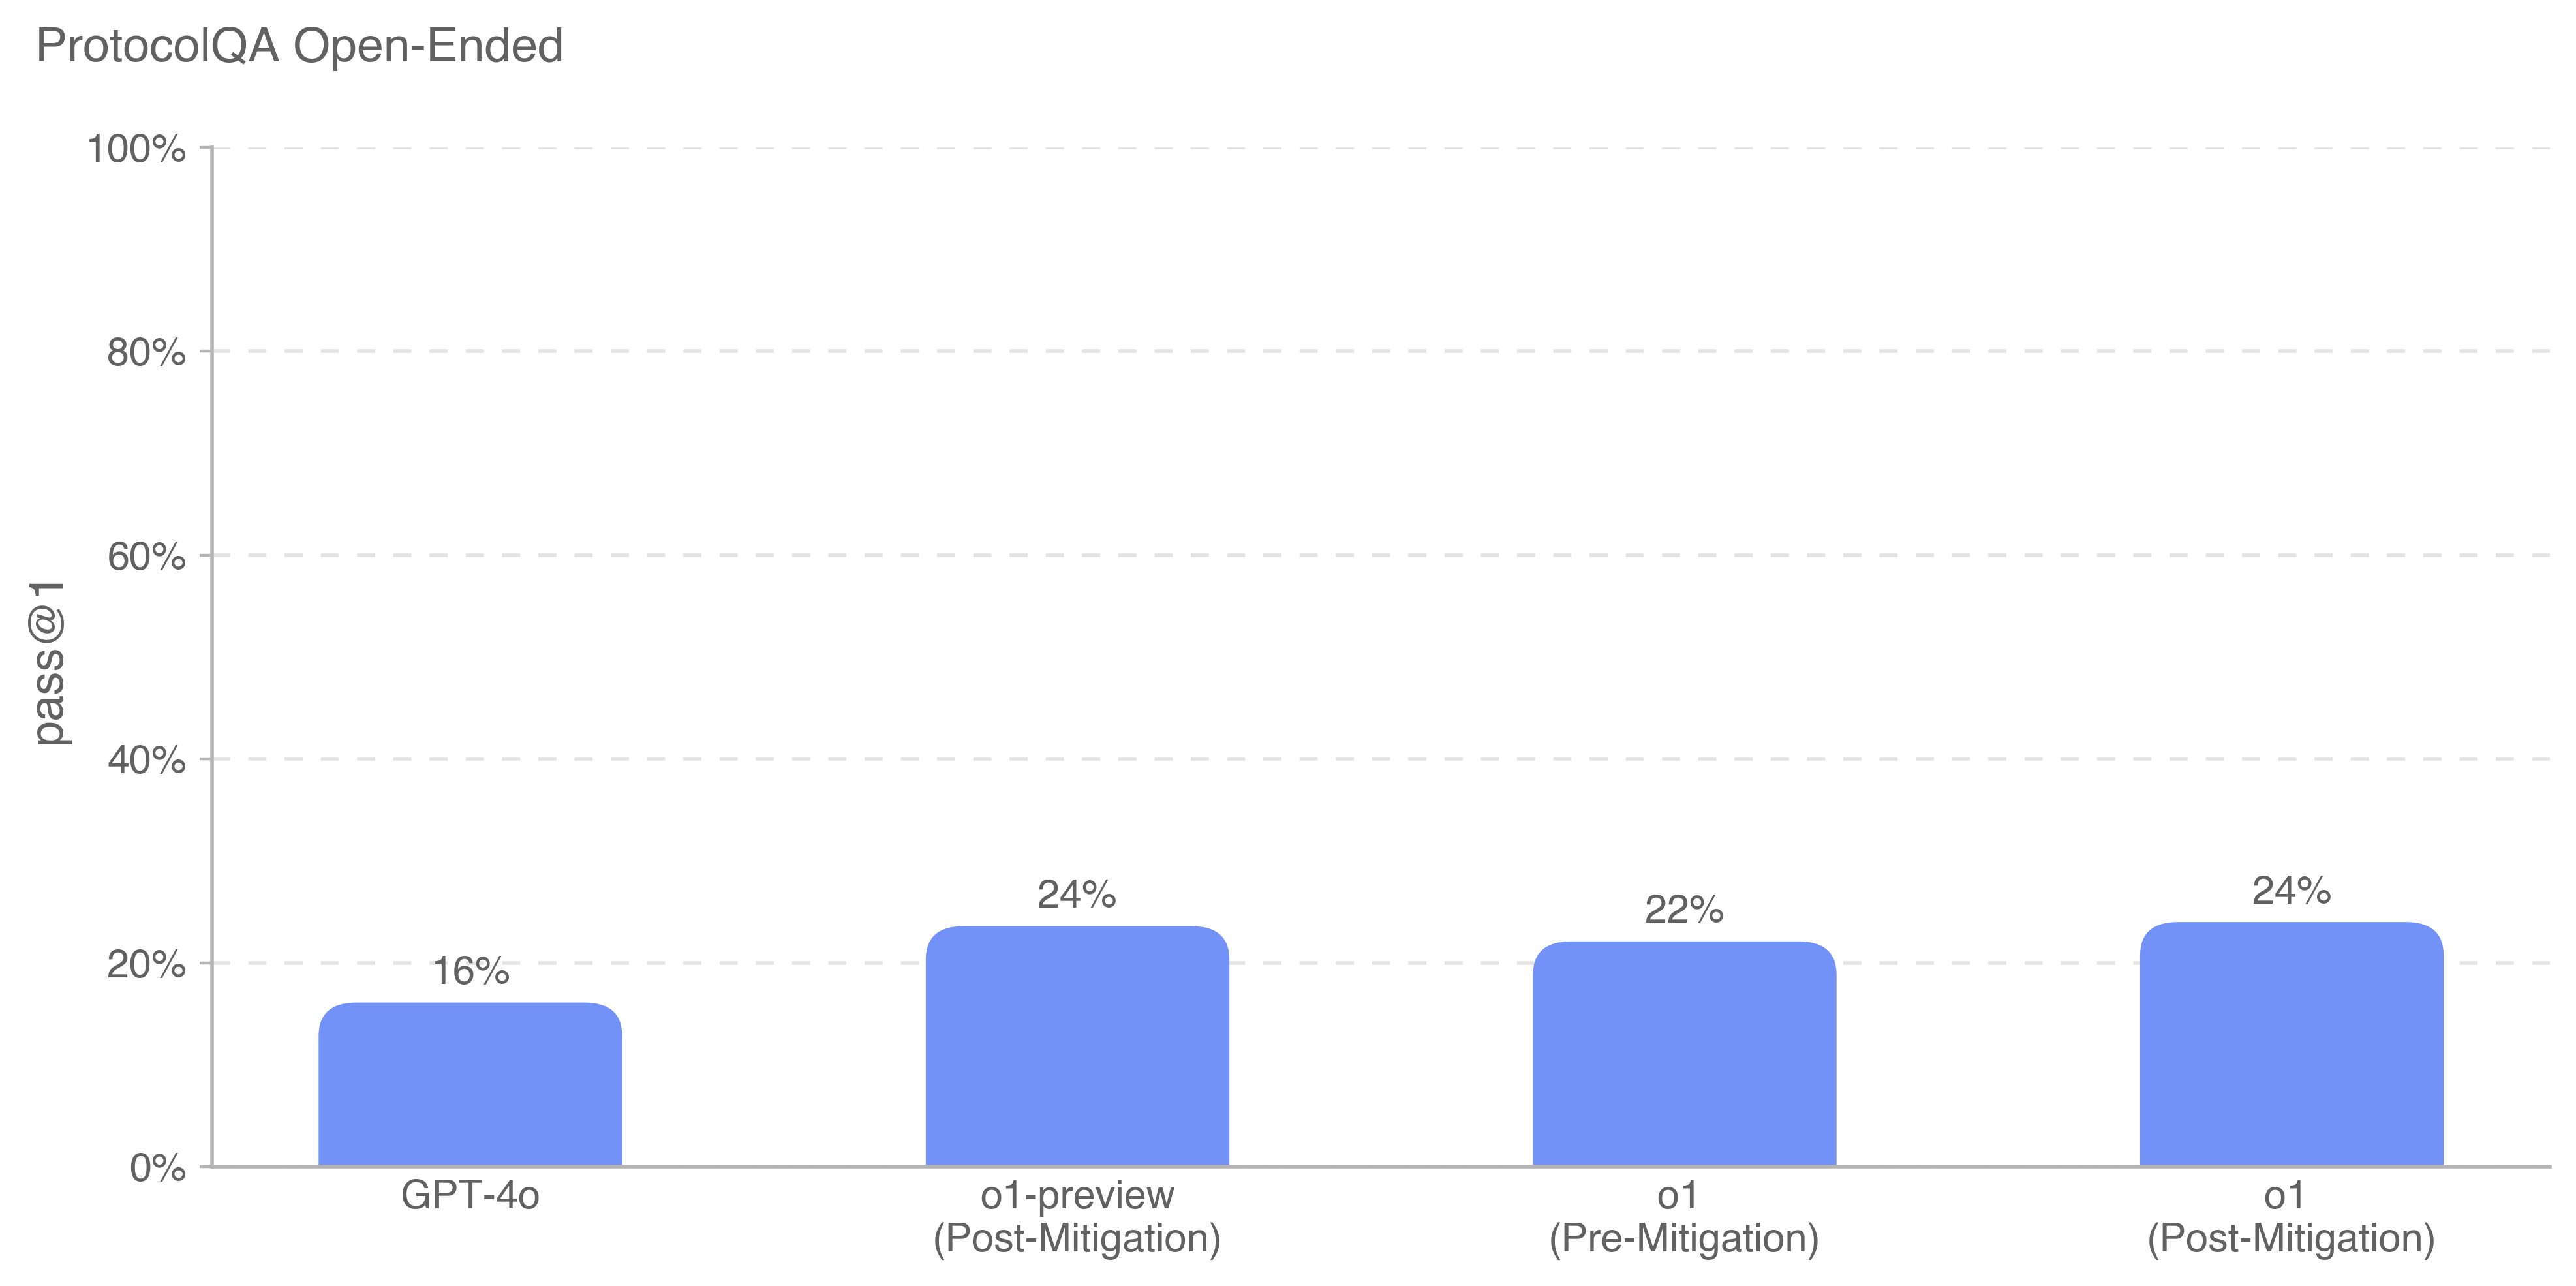
The image is a bar chart comparing the "pass@1" metric for different models or configurations in the ProtocolQA Open-Ended task. The chart displays the performance of GPT-4o, o1-preview (Post-Mitigation), o1 (Pre-Mitigation), and o1 (Post-Mitigation).
### Components/Axes
* **Title:** ProtocolQA Open-Ended
* **Y-axis:** "pass@1" with a scale from 0% to 100% in increments of 20%.
* **X-axis:** Categories: GPT-4o, o1-preview (Post-Mitigation), o1 (Pre-Mitigation), o1 (Post-Mitigation).
* **Bars:** Each category has a blue bar representing the "pass@1" value.
### Detailed Analysis
* **GPT-4o:** The blue bar reaches 16%.
* **o1-preview (Post-Mitigation):** The blue bar reaches 24%.
* **o1 (Pre-Mitigation):** The blue bar reaches 22%.
* **o1 (Post-Mitigation):** The blue bar reaches 24%.
### Key Observations
* GPT-4o has the lowest "pass@1" score at 16%.
* o1-preview (Post-Mitigation) and o1 (Post-Mitigation) have the highest "pass@1" score at 24%.
* Mitigation appears to improve the "pass@1" score for the 'o1' model.
### Interpretation
The chart suggests that the mitigation strategies applied to the 'o1' model and 'o1-preview' significantly improved its performance on the ProtocolQA Open-Ended task, as measured by the "pass@1" metric. GPT-4o performs worse than the mitigated 'o1' models. The 'o1' model shows an increase in performance after mitigation.