\n
## Bar Chart: ProtocolQA Open-Ended Pass @ 1
### Overview
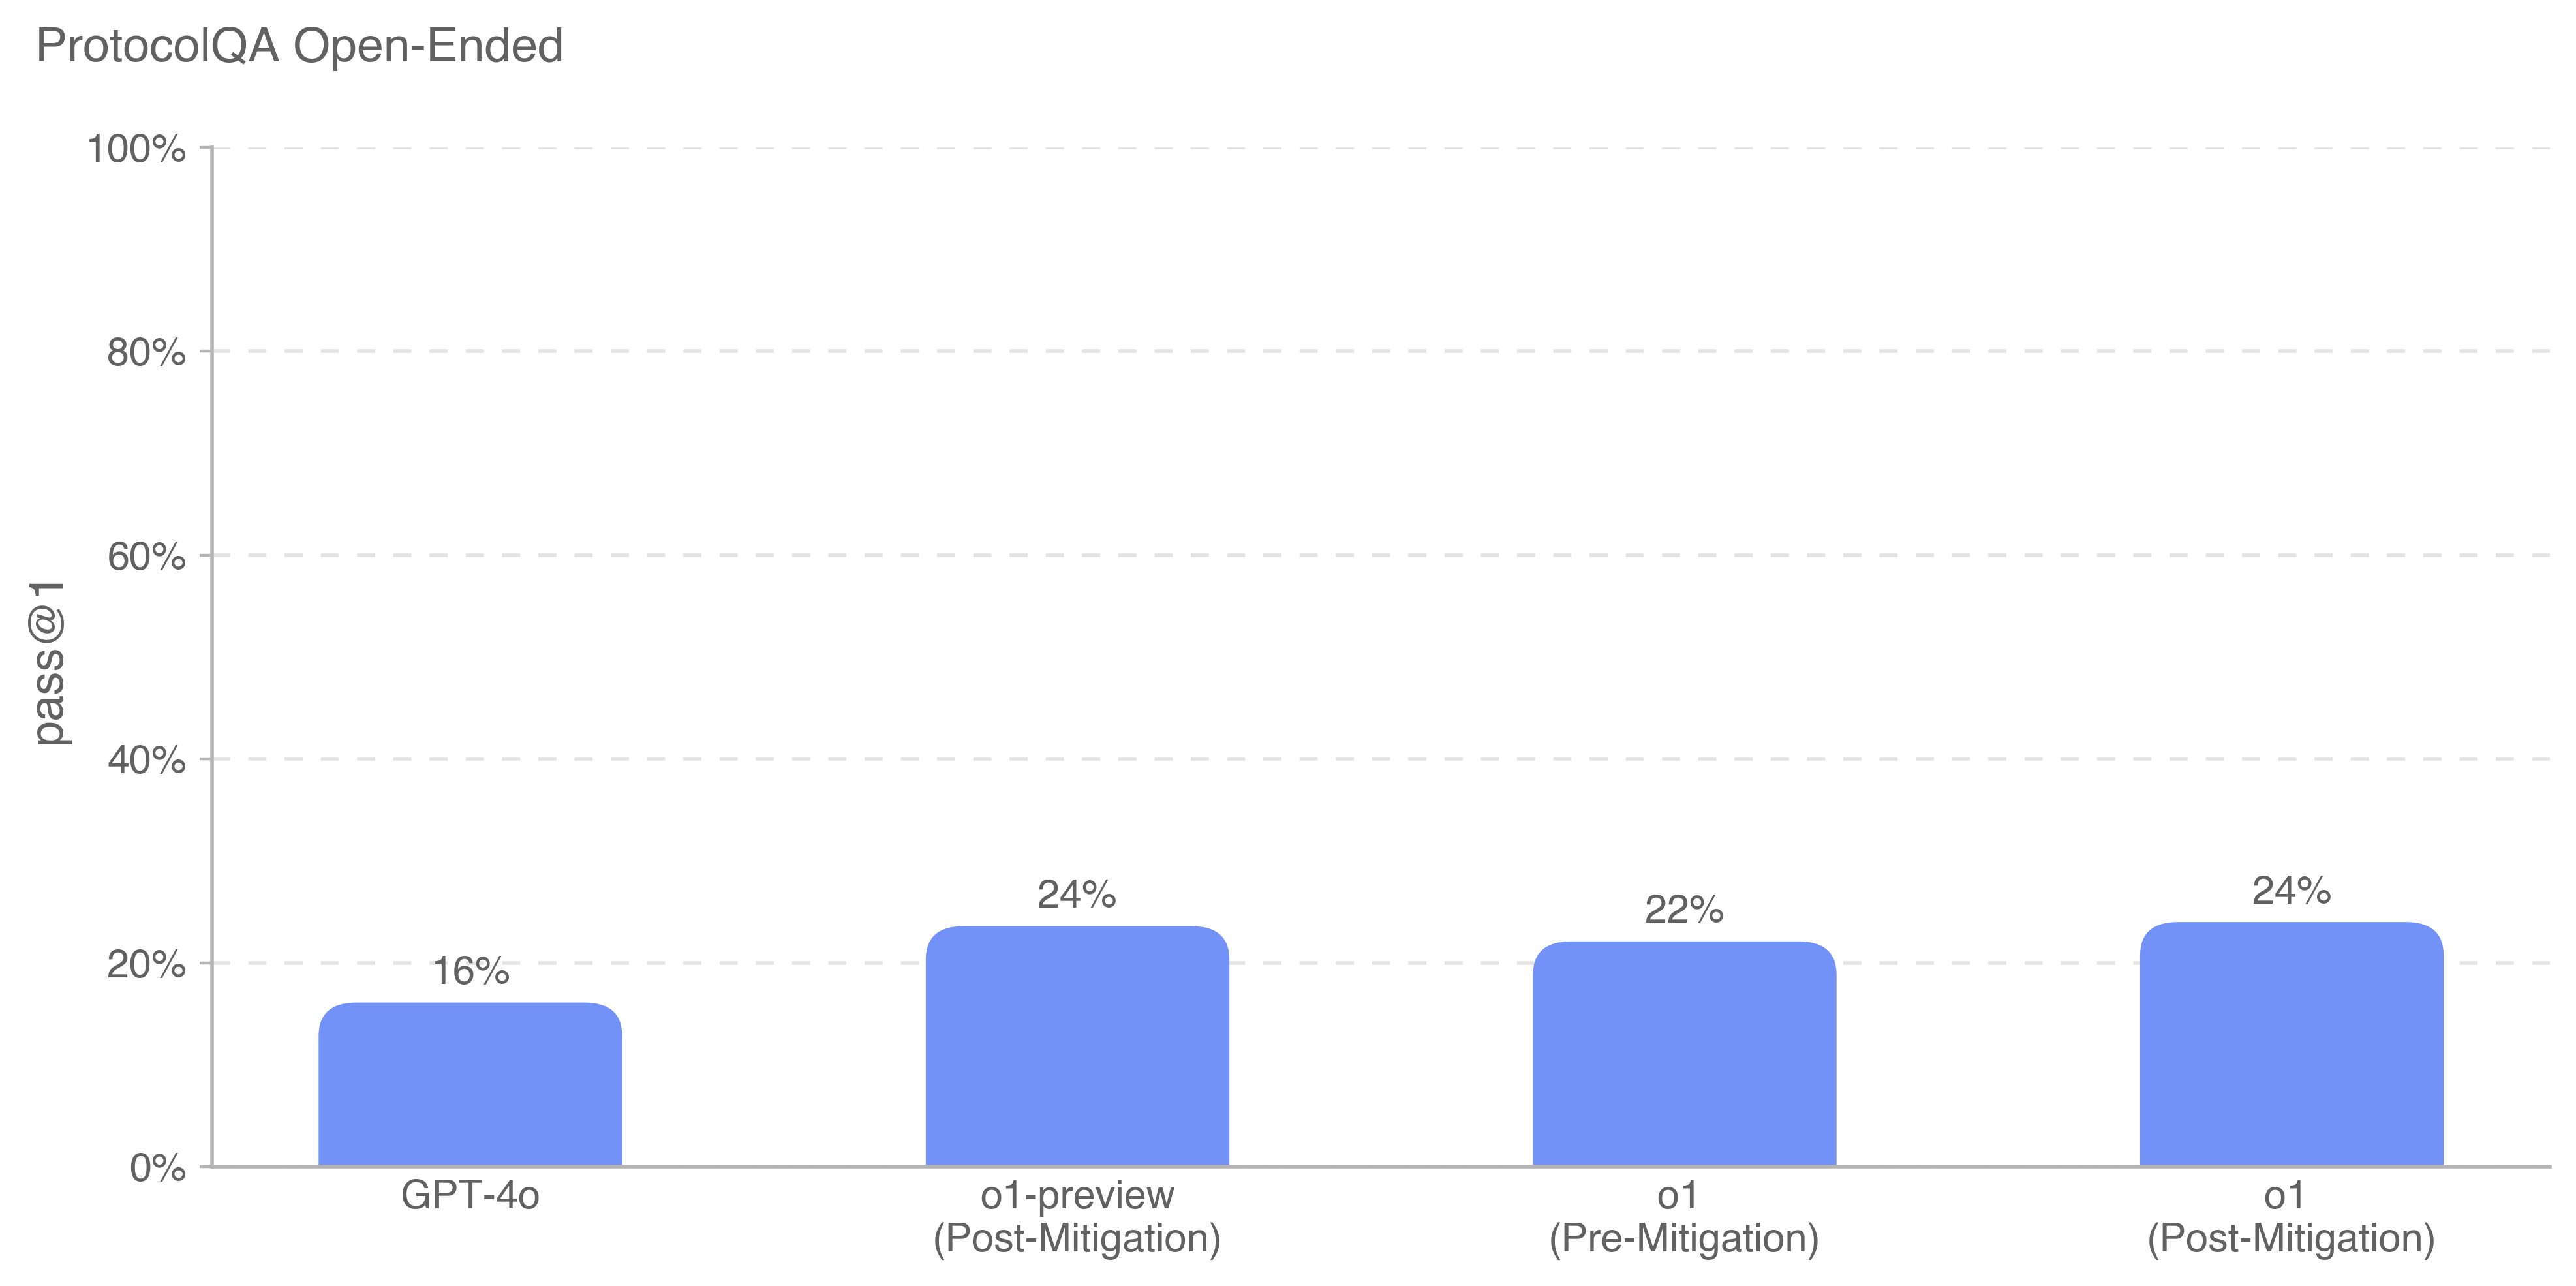
This bar chart displays the "pass @ 1" rate for different models on the ProtocolQA Open-Ended dataset. The models compared are GPT-4o, o1-preview (Post-Mitigation), o1 (Pre-Mitigation), and o1 (Post-Mitigation). The y-axis represents the percentage of successful passes, ranging from 0% to 100%.
### Components/Axes
* **Title:** ProtocolQA Open-Ended
* **X-axis Label:** Model Name (GPT-4o, o1-preview (Post-Mitigation), o1 (Pre-Mitigation), o1 (Post-Mitigation))
* **Y-axis Label:** pass @ 1 (Percentage)
* **Y-axis Scale:** Linear, from 0% to 100%, with increments of 20%.
* **Bars:** Represent the pass @ 1 rate for each model. All bars are the same light blue color.
### Detailed Analysis
The chart presents the following data points:
* **GPT-4o:** The bar for GPT-4o reaches approximately 16% on the y-axis.
* **o1-preview (Post-Mitigation):** The bar for o1-preview (Post-Mitigation) reaches approximately 24% on the y-axis.
* **o1 (Pre-Mitigation):** The bar for o1 (Pre-Mitigation) reaches approximately 22% on the y-axis.
* **o1 (Post-Mitigation):** The bar for o1 (Post-Mitigation) reaches approximately 24% on the y-axis.
### Key Observations
* GPT-4o has the lowest pass @ 1 rate among the models tested.
* o1-preview (Post-Mitigation) and o1 (Post-Mitigation) have the highest pass @ 1 rates, both at approximately 24%.
* o1 (Pre-Mitigation) has a pass @ 1 rate of approximately 22%, slightly lower than the two post-mitigation models.
* The post-mitigation versions of the 'o1' model perform similarly to each other.
### Interpretation
The data suggests that the mitigation strategies applied to the 'o1' model have a positive impact on its performance on the ProtocolQA Open-Ended dataset, bringing its pass rate closer to that of GPT-4o. The 'o1' models with post-mitigation perform similarly, indicating the mitigation strategy is consistent. GPT-4o, while still performing lower than the post-mitigated 'o1' models, is a different model architecture and may have different strengths and weaknesses. The "pass @ 1" metric likely refers to the percentage of times the model's first attempt at answering a question is correct. The chart demonstrates the effectiveness of mitigation techniques in improving the performance of the 'o1' model on this specific task. The relatively low overall pass rates suggest that the ProtocolQA Open-Ended dataset is a challenging benchmark.