## Bar Chart: ProtocolQA Open-Ended Performance Comparison
### Overview
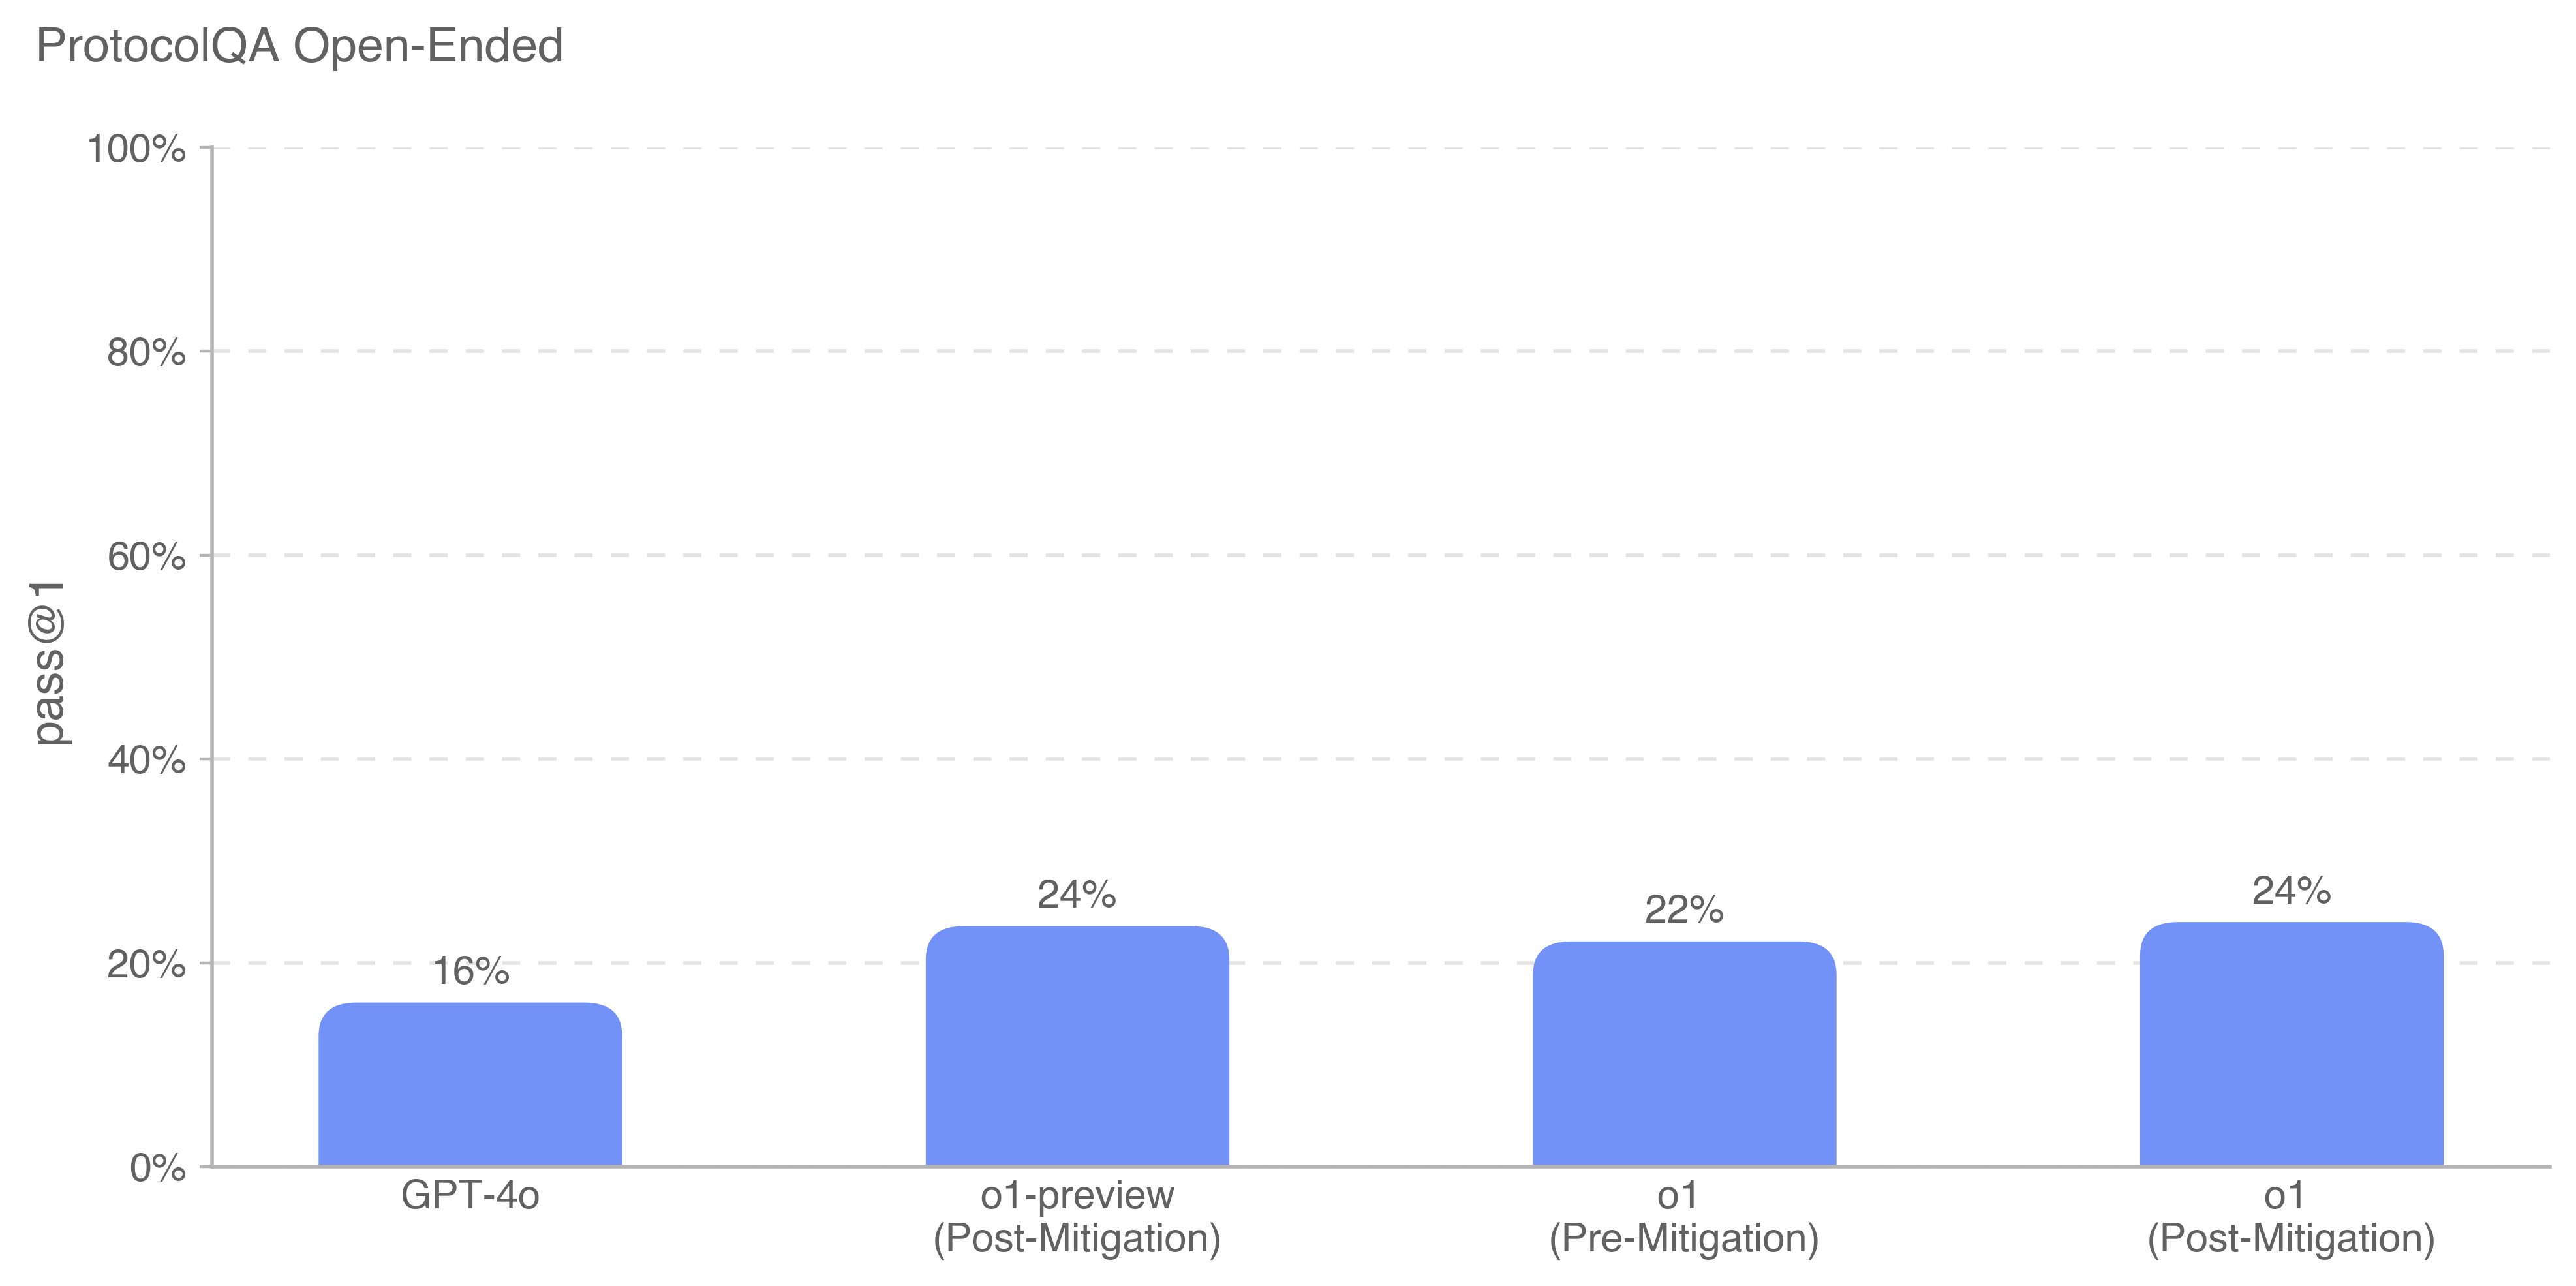
The chart compares the "pass@1" performance of four AI models across different versions and mitigation states. The y-axis represents pass@1 percentage (0-100%), while the x-axis categorizes models by version and mitigation status.
### Components/Axes
- **X-Axis Categories**:
1. GPT-4o
2. o1-preview (Post-Mitigation)
3. o1 (Pre-Mitigation)
4. o1 (Post-Mitigation)
- **Y-Axis**: Pass@1 percentage (0-100%)
- **Legend**: Single blue color representing all data points (no explicit legend visible)
### Detailed Analysis
1. **GPT-4o**: 16% pass@1 (lowest performance)
2. **o1-preview (Post-Mitigation)**: 24% pass@1
3. **o1 (Pre-Mitigation)**: 22% pass@1
4. **o1 (Post-Mitigation)**: 24% pass@1
### Key Observations
- **Mitigation Impact**:
- o1's pass@1 increased from 22% (pre-mitigation) to 24% (post-mitigation)
- o1-preview maintains 24% post-mitigation
- **Model Comparison**:
- GPT-4o underperforms all o1 variants by 8-10 percentage points
- o1 variants show consistent performance post-mitigation
### Interpretation
The data suggests mitigation strategies significantly improve open-ended task performance for o1 models, achieving parity between o1-preview and o1 post-mitigation. GPT-4o's lower baseline performance (16%) indicates potential architectural or training differences compared to o1 models. The 2% improvement in o1 post-mitigation versus pre-mitigation demonstrates the effectiveness of mitigation techniques in enhancing reasoning capabilities for complex queries. The consistent 24% performance across mitigated o1 variants suggests standardized evaluation metrics across model versions.