## Dataset Examples: Logic and LogicClimate
### Overview
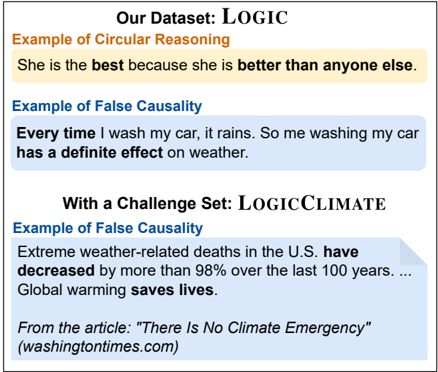
The image presents examples of logical fallacies from two datasets: "LOGIC" and "LOGICCLIMATE". The "LOGIC" dataset includes examples of circular reasoning and false causality. The "LOGICCLIMATE" dataset, a challenge set, also includes an example of false causality related to climate change.
### Components/Axes
* **Title:** Our Dataset: LOGIC
* **Example of Circular Reasoning:**
* Text: "She is the best because she is better than anyone else."
* **Example of False Causality:**
* Text: "Every time I wash my car, it rains. So me washing my car has a definite effect on weather."
* **Title:** With a Challenge Set: LOGICCLIMATE
* **Example of False Causality:**
* Text: "Extreme weather-related deaths in the U.S. have decreased by more than 98% over the last 100 years. ... Global warming saves lives."
* Source: "From the article: "There Is No Climate Emergency" (washingtontimes.com)"
### Detailed Analysis or ### Content Details
The image provides specific examples of logical fallacies.
1. **LOGIC Dataset:**
* **Circular Reasoning:** The statement "She is the best because she is better than anyone else" is a circular argument because it uses the claim itself as evidence.
* **False Causality:** The statement "Every time I wash my car, it rains. So me washing my car has a definite effect on weather" suggests a causal relationship where none likely exists. This is a post hoc ergo propter hoc fallacy (after this, therefore because of this).
2. **LOGICCLIMATE Dataset:**
* **False Causality:** The statement "Extreme weather-related deaths in the U.S. have decreased by more than 98% over the last 100 years. ... Global warming saves lives" implies that global warming is the cause of the decrease in deaths, which is a potentially misleading oversimplification. The statement is attributed to an article titled "There Is No Climate Emergency" from washingtontimes.com.
### Key Observations
* The image highlights the use of logical fallacies in arguments, particularly in the context of climate change.
* The "LOGICCLIMATE" dataset is presented as a challenge set, suggesting that it contains more complex or controversial examples.
* The source of the climate change example is explicitly stated, indicating a specific viewpoint or potential bias.
### Interpretation
The image demonstrates how logical fallacies can be used to construct arguments, even when those arguments are flawed. The inclusion of a climate change-related example suggests that these fallacies are relevant to contemporary debates. The use of a "challenge set" implies that identifying and analyzing these fallacies can be difficult, requiring critical thinking and careful evaluation of evidence. The example from the "LOGICCLIMATE" dataset, sourced from an article questioning the existence of a climate emergency, suggests that the dataset may be designed to expose flawed reasoning within specific viewpoints on climate change.