## Diagram: Neural Dynamics in a Simulated Pong Environment
### Overview
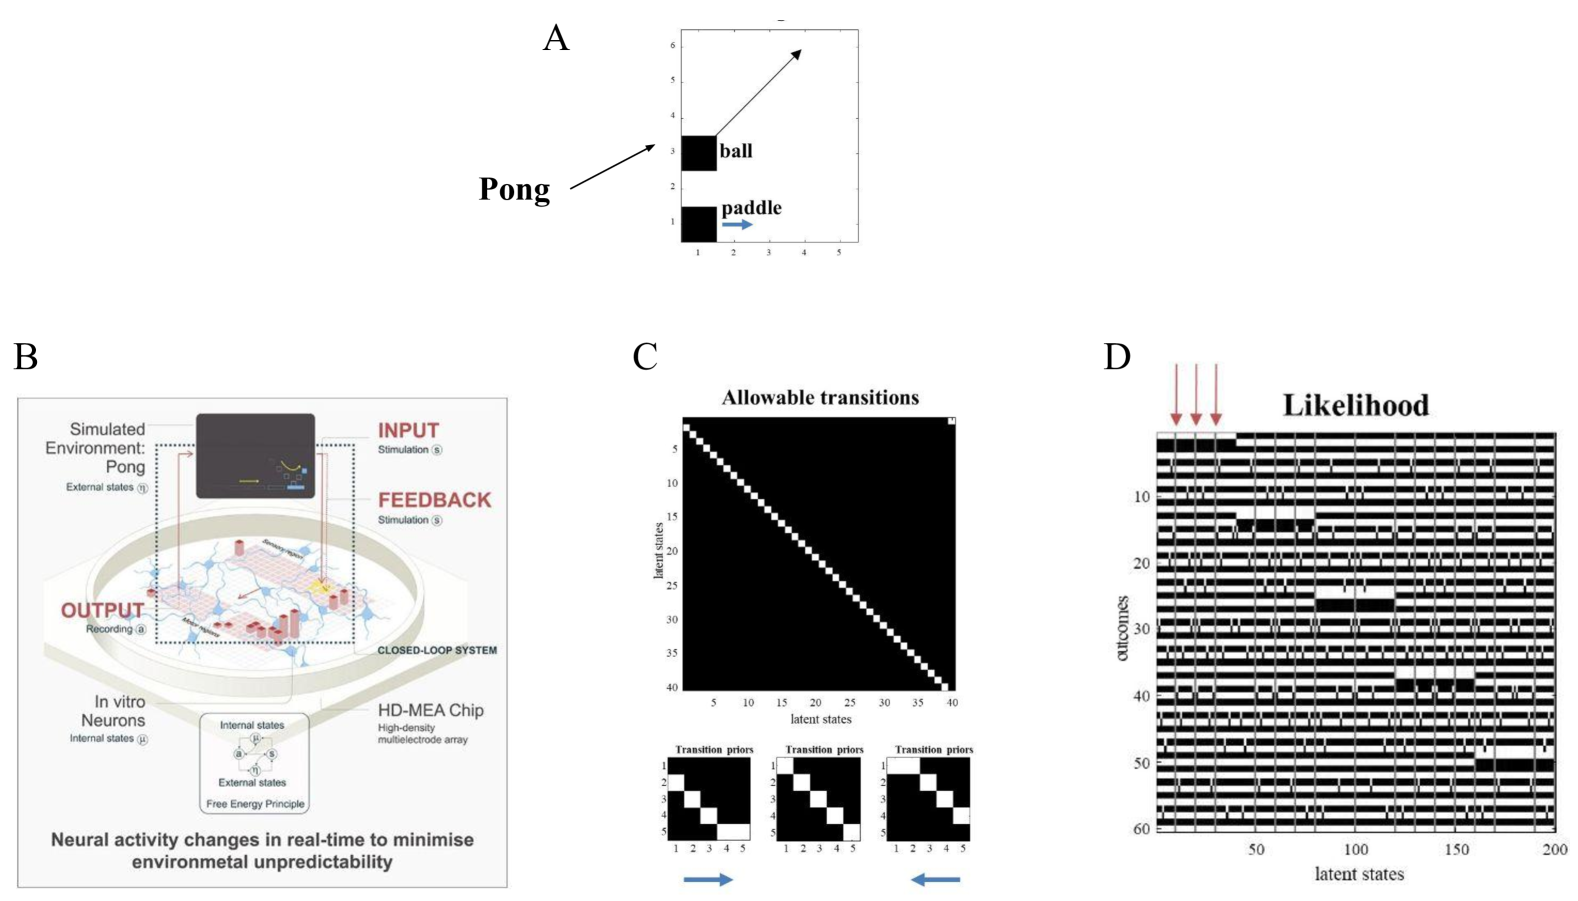
The image presents a series of diagrams (A, B, C, and D) illustrating a computational model of neural activity within a simulated Pong environment. The model aims to demonstrate how neural activity changes in real-time to minimize environmental unpredictability, potentially reflecting principles of free energy.
### Components/Axes
* **A: Pong Simulation:** A simplified representation of the Pong game, showing a paddle and a ball. The paddle is positioned along a horizontal axis labeled "1 2 3 4 5". An arrow indicates the ball's trajectory. The label "Pong" is present.
* **B: Closed-Loop System:** A circular diagram depicting the flow of information within the system. Key components are labeled: "INPUT (Stimulation β)", "FEEDBACK (Stimulation β)", "OUTPUT (Recording)", and "CLOSED-LOOP SYSTEM". A central representation of neural connections is shown, labeled "HD-MEA Chip" and "High-density microelectrode array". Below this, a smaller diagram shows "Internal states" and "External states" connected by "Free Energy Principle". The text "Neural activity changes in real-time to minimise environmental unpredictability" is present.
* **C: Allowable Transitions:** A heatmap-like diagram showing allowable transitions between latent states. The x-axis is labeled "latent states" ranging from approximately 5 to 45. The y-axis is labeled "latent states" ranging from approximately 5 to 40. The diagram is filled with black and white squares, indicating the presence or absence of allowable transitions. Below the main heatmap are three smaller heatmaps labeled "Transition priors" with numbers 1, 2, 3, 4, 5 along the x-axis.
* **D: Likelihood:** A heatmap-like diagram showing likelihood values. The x-axis is labeled "latent states" ranging from approximately 50 to 200. The y-axis is labeled "outcomes" ranging from approximately 10 to 60. The diagram is filled with black and white squares, indicating the likelihood of different outcomes for given latent states. Arrows point down from the label "Likelihood".
### Detailed Analysis or Content Details
* **A: Pong Simulation:** The paddle is positioned around the value "3" on the horizontal axis. The ball is moving towards the paddle.
* **B: Closed-Loop System:** The diagram illustrates a feedback loop. Input (stimulation) leads to output (recording), which then provides feedback to adjust the input. The HD-MEA chip represents the hardware used to record neural activity. The "Free Energy Principle" suggests that the system attempts to minimize the difference between its internal model of the world and the actual external states.
* **C: Allowable Transitions:** The heatmap shows a strong diagonal pattern, indicating that transitions to adjacent latent states are more likely. The transition priors show a similar pattern, with higher values along the diagonal. The transition priors are represented by three separate heatmaps, each with the same x-axis (1-5) and a similar pattern of higher values along the diagonal.
* **D: Likelihood:** The likelihood heatmap shows a complex pattern of black and white squares. There is no clear trend, but there are regions with higher densities of black squares, indicating higher likelihoods.
### Key Observations
* The Pong simulation (A) provides a simple environment for studying neural dynamics.
* The closed-loop system (B) highlights the importance of feedback in regulating neural activity.
* The allowable transitions (C) suggest that the system explores a limited range of latent states.
* The likelihood diagram (D) reveals the probabilistic relationship between latent states and outcomes.
### Interpretation
The diagrams collectively suggest a computational model of how neural systems might learn to predict and control their environment. The Pong game serves as a simplified testbed for this model. The closed-loop system emphasizes the role of feedback in minimizing prediction errors. The latent state diagrams (C and D) provide insights into the internal representations that the system uses to make predictions and guide its actions. The "Free Energy Principle" provides a theoretical framework for understanding how the system minimizes unpredictability.
The diagonal patterns in the transition priors (C) suggest that the system favors smooth transitions between states, which is consistent with the idea that neural activity changes gradually over time. The complex pattern in the likelihood diagram (D) indicates that the relationship between latent states and outcomes is not straightforward, but rather probabilistic. This is likely due to the inherent uncertainty in the environment and the limitations of the model.
The diagrams demonstrate a computational approach to understanding neural dynamics, potentially offering insights into how brains learn and adapt to their surroundings.