TECHNICAL ASSET FINGERPRINT
f018cf06807b2bb1223f7499
Click to view fullscreen
Press ESC or click to close
FOUND IN PAPERS
EXPERT: healer-alpha-free VERSION 1
RUNTIME: free/openrouter/healer-alpha
INTEL_VERIFIED
\n
## Multi-Panel Scientific Figure: Neural Closed-Loop System for Pong
### Overview
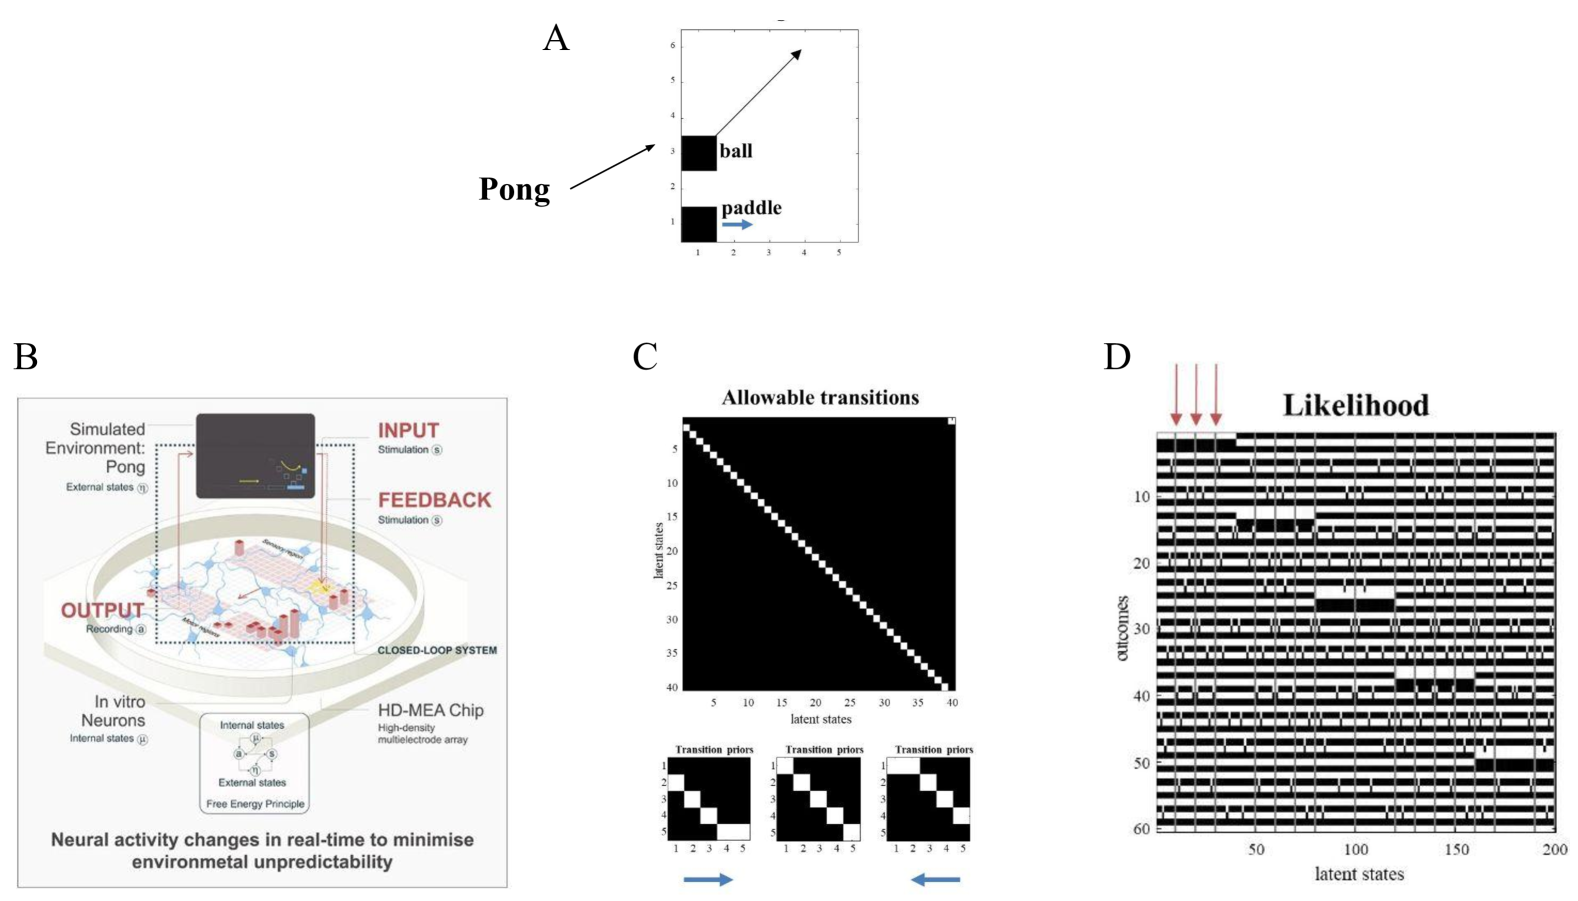
This image is a composite scientific figure consisting of four panels (A, B, C, D) illustrating a closed-loop system where *in vitro* neural activity on a high-density microelectrode array (HD-MEA) chip interacts with a simulated Pong game environment. The system is framed within the Free Energy Principle, where neural activity changes in real-time to minimize environmental unpredictability.
### Components/Axes
**Panel A (Top Center):**
* **Title/Label:** "A" (top-left of panel).
* **Diagram:** A simplified schematic of the game Pong.
* **Text Elements:**
* "Pong" (with an arrow pointing to the diagram).
* "ball" (label next to a black square).
* "paddle" (label next to a black rectangle).
* **Axes:** The diagram is plotted on a 2D grid.
* **X-axis:** Numbered from 1 to 5.
* **Y-axis:** Numbered from 1 to 6.
* **Visual Elements:** A black square ("ball") at approximately (1, 3) with an arrow pointing diagonally up and right. A black rectangle ("paddle") at approximately (1, 1) with a blue arrow pointing right.
**Panel B (Bottom Left):**
* **Title/Label:** "B" (top-left of panel).
* **Diagram Type:** System architecture diagram for a "CLOSED-LOOP SYSTEM".
* **Text Elements & Components (Spatially Organized):**
* **Top Left:** "Simulated Environment: Pong" with sub-label "External states (η)".
* **Top Right:** "INPUT" in red, with "Stimulation (S)" below it.
* **Center:** An illustration of a petri dish containing a neural network, labeled "In vitro Neurons" with sub-label "Internal states (μ)".
* **Center Right:** "FEEDBACK" in red, with "Stimulation (S)" below it.
* **Bottom Left:** "OUTPUT" in red, with "Recording (R)" below it.
* **Bottom Right:** "HD-MEA Chip" with sub-label "High-density multielectrode array".
* **Bottom Center:** A box labeled "Free Energy Principle" containing a diagram with "Internal states (μ)" and "External states (η)".
* **Bottom Caption:** "Neural activity changes in real-time to minimise environmental unpredictability".
* **Flow/Arrows:** Dotted red lines show a loop: from the Simulated Environment (Pong) -> INPUT (Stimulation) -> Neurons -> OUTPUT (Recording) -> back to the Simulated Environment. Solid black lines connect the neurons to the HD-MEA Chip and the Free Energy Principle box.
**Panel C (Bottom Center):**
* **Title/Label:** "C" (top-left of panel).
* **Chart Type:** Heatmap.
* **Main Title:** "Allowable transitions".
* **Axes:**
* **X-axis:** "latent states", numbered from 5 to 40 in increments of 5.
* **Y-axis:** "latent units", numbered from 5 to 40 in increments of 5.
* **Data Pattern:** A black background with a diagonal line of white squares running from the top-left (low latent state/unit) to the bottom-right (high latent state/unit). This indicates a one-to-one mapping or allowable transition between corresponding latent states and units.
* **Subplots (Below Main Heatmap):**
* Three smaller heatmaps, each titled "Transition priors".
* Each has axes numbered 1 to 5.
* Each shows a 5x5 black grid with a single white square in a different position, forming a diagonal pattern across the three plots.
* **Arrows:** A blue arrow pointing right is below the left subplot. A blue arrow pointing left is below the right subplot.
**Panel D (Bottom Right):**
* **Title/Label:** "D" (top-left of panel).
* **Chart Type:** Heatmap.
* **Main Title:** "Likelihood".
* **Axes:**
* **X-axis:** "latent states", numbered from 50 to 200 in increments of 50.
* **Y-axis:** "outcomes", numbered from 10 to 60 in increments of 10.
* **Data Pattern:** A black background with a complex pattern of horizontal white stripes of varying lengths and positions. The stripes are denser and more continuous in the lower half of the chart (outcomes 30-60) and more fragmented in the upper half (outcomes 10-30).
* **Annotations:** Three red arrows point downward from the top edge of the chart, aligned approximately with latent states 20, 40, and 60.
### Detailed Analysis
* **Panel A:** Defines the external task. The ball's trajectory (arrow) and paddle's movement direction (blue arrow) are the key dynamic elements.
* **Panel B:** Details the experimental loop. The "Internal states (μ)" of the neurons are influenced by "Stimulation (S)" (INPUT/FEEDBACK) from the game and produce "Recording (R)" (OUTPUT) that affects the game. The Free Energy Principle is presented as the theoretical framework governing this interaction.
* **Panel C:** The main heatmap shows a strict, diagonal "allowable transitions" matrix, suggesting a highly structured or constrained relationship between latent states and latent units. The "Transition priors" subplots likely show specific, simple transition rules (e.g., state 1->2, 2->3, etc.).
* **Panel D:** The "Likelihood" heatmap shows the probability (indicated by white) of various "outcomes" given different "latent states". The pattern is not uniform; certain outcome bands (e.g., around 40-50) are highly likely across many latent states, while others are more sporadic. The red arrows may highlight specific latent states of interest.
### Key Observations
1. **Structured Constraint:** Panel C's perfect diagonal indicates a non-random, possibly engineered or learned, one-to-one mapping in the system's internal dynamics.
2. **Outcome Variability:** Panel D shows that the likelihood of outcomes is highly dependent on the latent state, with clear bands of high and low probability.
3. **Theoretical Framework:** The explicit inclusion of the "Free Energy Principle" in Panel B is a key conceptual component, framing the entire experiment as a process of minimizing surprise or prediction error.
4. **Real-Time Adaptation:** The caption in Panel B emphasizes the *real-time* nature of the neural adaptation, which is central to the closed-loop concept.
### Interpretation
This figure describes an experiment designed to test if a biological neural network (in vitro neurons) can learn to control a simple external environment (Pong) by adhering to the Free Energy Principle.
* **What it demonstrates:** The setup aims to show that neural activity isn't just a passive recorder but an active inference engine. By receiving feedback (stimulation) from the game state and generating output (recordings) that move the paddle, the network attempts to build an accurate internal model (latent states) of the external world (the ball's movement) to minimize long-term prediction error (environmental unpredictability).
* **Relationship between elements:** Panel A is the external world. Panel B is the embodied interface between biology and that world. Panels C and D likely represent the internal, learned model of the system. Panel C's diagonal suggests the network may have developed a clean, segregated representation where specific internal units track specific game states. Panel D shows how these internal representations (latent states) map to observable game outcomes, revealing the network's predictive model.
* **Anomalies/Notable Points:** The stark contrast between the clean, diagonal structure in Panel C and the complex, banded pattern in Panel D is striking. It suggests that while the internal state transitions may be simple and orderly, the mapping from those states to external outcomes is rich and probabilistic. The red arrows in Panel D may point to latent states where the outcome likelihood distribution changes significantly, possibly corresponding to critical events in the game (e.g., the ball crossing a midpoint).
DECODING INTELLIGENCE...