## Line Chart: Model Performance Scores Across Benchmarks
### Overview
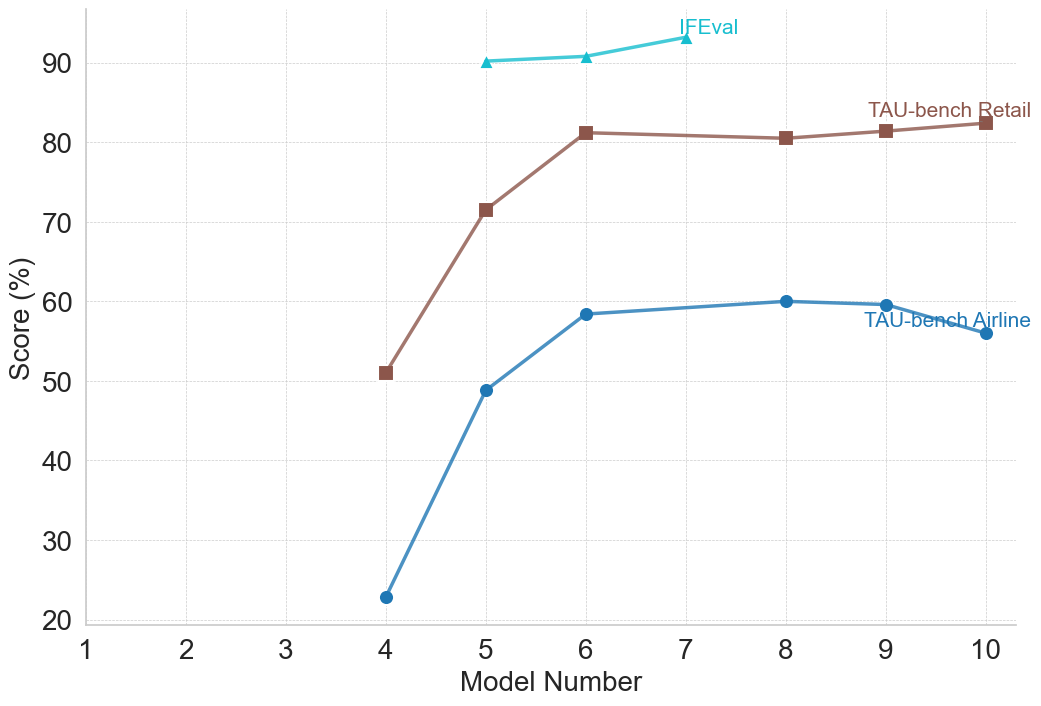
This image is a line chart displaying the performance scores of various iterations of a model (labeled by "Model Number") across three different evaluation benchmarks. The chart illustrates how performance evolves as the model number increases, showing a general trend of rapid initial improvement followed by a plateau.
### Components/Axes
**Spatial Grounding & Layout:**
* **Main Chart Area:** Occupies the majority of the image, featuring a white background with faint, dashed, light-gray gridlines forming a matrix.
* **X-Axis (Bottom):** Labeled **"Model Number"** in black text, centered below the axis. The axis features major tick marks at integer intervals from 1 to 10 (1, 2, 3, 4, 5, 6, 7, 8, 9, 10).
* **Y-Axis (Left):** Labeled **"Score (%)"** in black text, rotated 90 degrees counter-clockwise, centered along the axis. The axis features major tick marks at intervals of 10, ranging from 20 to 90 (20, 30, 40, 50, 60, 70, 80, 90). The grid extends slightly above the 90 mark to approximately 100.
* **Legend:** There is no separate legend box. Instead, the data series are labeled directly on the chart area (in-line labeling) adjacent to their respective lines.
**Data Series Identifiers:**
1. **IFEval:** Cyan/light blue line with triangle markers. Label is positioned at the top right of the line, near Model Number 7.
2. **TAU-bench Retail:** Brown line with square markers. Label is positioned above the rightmost end of the line, spanning Model Numbers 9 and 10.
3. **TAU-bench Airline:** Dark blue line with circular markers. Label is positioned below the rightmost end of the line, spanning Model Numbers 9 and 10.
---
### Detailed Analysis
*Note: Values are approximate based on visual interpolation of the gridlines.*
#### Series 1: IFEval (Cyan/Light Blue, Triangle Markers)
* **Trend Verification:** This line appears only for Model Numbers 5, 6, and 7. It starts at a very high baseline and slopes gently upward, indicating slight, incremental improvements.
* **Data Points:**
* Model 5: ~90.0%
* Model 6: ~91.0%
* Model 7: ~93.0%
#### Series 2: TAU-bench Retail (Brown, Square Markers)
* **Trend Verification:** This line begins at Model 4. It shows a steep, aggressive upward slope between Models 4 and 6. After Model 6, the line plateaus, showing a very slight dip at Model 8 before rising marginally through Model 10. *Note: There is no data point marker at Model 7; the line connects directly from 6 to 8.*
* **Data Points:**
* Model 4: ~51.0%
* Model 5: ~71.5%
* Model 6: ~81.0%
* Model 7: *(No marker)*
* Model 8: ~80.5%
* Model 9: ~81.5%
* Model 10: ~82.5%
#### Series 3: TAU-bench Airline (Dark Blue, Circle Markers)
* **Trend Verification:** This line begins at Model 4. Similar to the Retail benchmark, it exhibits a steep upward trajectory from Model 4 to Model 6. It then plateaus, peaking slightly at Model 8, before sloping downward toward Model 10, indicating a regression in performance. *Note: There is no data point marker at Model 7; the line connects directly from 6 to 8.*
* **Data Points:**
* Model 4: ~23.0%
* Model 5: ~49.0%
* Model 6: ~58.5%
* Model 7: *(No marker)*
* Model 8: ~60.0%
* Model 9: ~59.5%
* Model 10: ~56.0%
---
### Key Observations
1. **Missing Data:** Models 1, 2, and 3 have no data points for any benchmark. Model 7 lacks data points for both TAU-bench metrics. The IFEval metric is only tracked for models 5, 6, and 7.
2. **Rapid Capability Gain:** The transition from Model 4 to Model 6 represents a massive leap in capability for the TAU-bench metrics (Retail jumps ~30 points; Airline jumps ~35 points).
3. **Diminishing Returns / Plateau:** After Model 6, the rapid gains cease. Models 8, 9, and 10 show stagnation in the Retail benchmark and actual degradation (regression) in the Airline benchmark.
4. **Benchmark Difficulty:** There is a clear hierarchy of difficulty or baseline competency. IFEval scores are consistently in the 90s. TAU-bench Retail scores stabilize in the low 80s. TAU-bench Airline is clearly the most difficult task for these models, starting the lowest and struggling to break 60%.
---
### Interpretation
From a Peircean investigative standpoint, this chart tells a classic story of machine learning model development: the "S-curve" of scaling or iterative training.
* **The "Aha!" Phase (Models 4-6):** The steep climb suggests that whatever changes were made between versions 4, 5, and 6 (whether increased parameter count, better training data, or architectural tweaks) successfully unlocked the core competencies required for the TAU-bench tasks.
* **Saturation and Overfitting (Models 8-10):** The plateauing of the Retail score and the active decline of the Airline score suggest that the model architecture or training paradigm has hit a wall regarding these specific tasks. The drop in the Airline score at Model 10 is a strong indicator of "catastrophic forgetting" or overfitting—where optimizing the model for other tasks (perhaps IFEval, though we lack data past model 7) has actively harmed its ability to perform the complex reasoning required for the Airline benchmark.
* **Task Complexity:** The persistent gap between "Retail" and "Airline" implies that the Airline benchmark requires a fundamentally different or more complex type of reasoning (e.g., multi-step constraints, stricter rule-following) that the current model lineage has not yet mastered, despite general improvements.