## Line Chart: Model Performance Comparison
### Overview
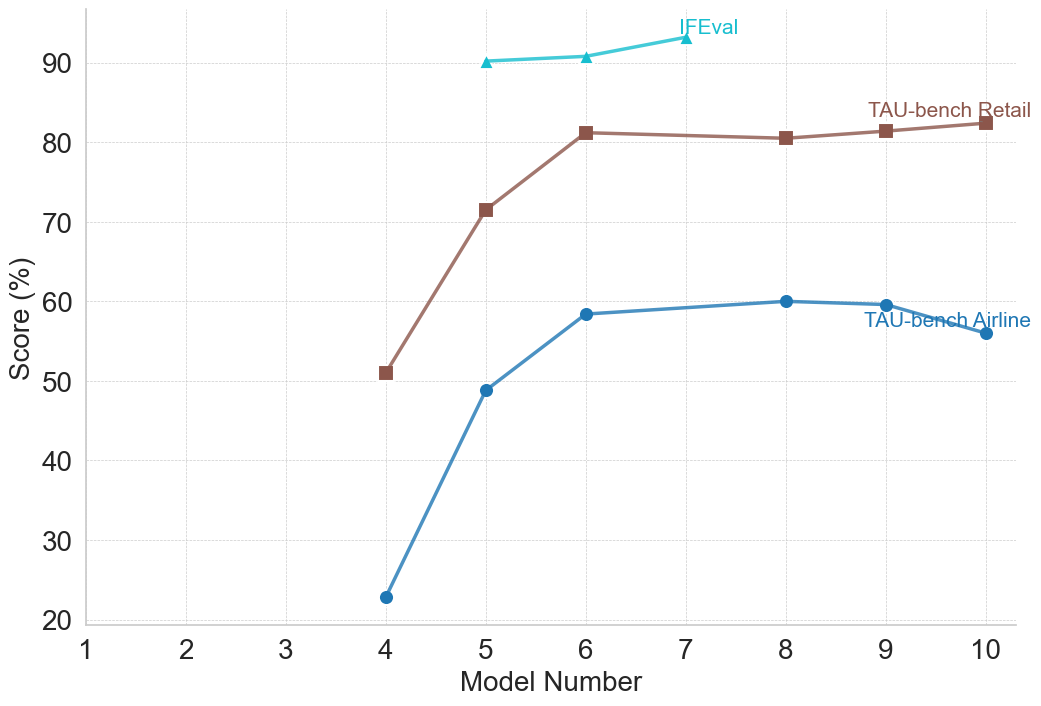
The image is a line chart comparing the performance of three different models: IFEval, TAU-bench Retail, and TAU-bench Airline. The x-axis represents the "Model Number" ranging from 1 to 10, and the y-axis represents the "Score (%)" ranging from 20 to 90. Each model's performance is plotted as a line, showing how the score changes with different model numbers.
### Components/Axes
* **X-axis:** "Model Number" with tick marks at 1, 2, 3, 4, 5, 6, 7, 8, 9, and 10.
* **Y-axis:** "Score (%)" with tick marks at 20, 30, 40, 50, 60, 70, 80, and 90.
* **Legend:** Located on the top-right of the chart, identifying the models:
* IFEval (light blue, triangle marker)
* TAU-bench Retail (brown, square marker)
* TAU-bench Airline (dark blue, circle marker)
### Detailed Analysis
* **IFEval (light blue, triangle marker):** The line starts at Model Number 5 with a score of approximately 90%, increases slightly to approximately 92% at Model Number 7, and remains relatively stable thereafter.
* Model 5: ~90%
* Model 7: ~92%
* **TAU-bench Retail (brown, square marker):** The line starts at Model Number 4 with a score of approximately 51%, increases sharply to approximately 72% at Model Number 5, and then to approximately 81% at Model Number 6. It remains relatively stable around 81% for Model Numbers 7 and 8, and increases slightly to approximately 82% at Model Number 10.
* Model 4: ~51%
* Model 5: ~72%
* Model 6: ~81%
* Model 8: ~81%
* Model 10: ~82%
* **TAU-bench Airline (dark blue, circle marker):** The line starts at Model Number 4 with a score of approximately 23%, increases sharply to approximately 49% at Model Number 5, and then to approximately 59% at Model Number 6. It remains relatively stable around 60% for Model Numbers 7 and 8, and decreases slightly to approximately 58% at Model Number 9, and then to approximately 56% at Model Number 10.
* Model 4: ~23%
* Model 5: ~49%
* Model 6: ~59%
* Model 8: ~60%
* Model 9: ~58%
* Model 10: ~56%
### Key Observations
* IFEval consistently outperforms the other two models, with scores above 90%.
* TAU-bench Retail shows a significant improvement from Model Number 4 to Model Number 6, then plateaus.
* TAU-bench Airline shows a significant improvement from Model Number 4 to Model Number 6, then plateaus, and decreases slightly at Model Numbers 9 and 10.
* The performance of TAU-bench Airline is significantly lower than the other two models, especially at lower model numbers.
### Interpretation
The chart suggests that IFEval is the most effective model among the three, consistently achieving high scores. TAU-bench Retail shows a strong initial improvement but plateaus, while TAU-bench Airline, although improving initially, has the lowest overall performance and even declines slightly in later model numbers. The data indicates that the model number has a varying impact on the performance of each model, with some models benefiting more from the changes than others. The performance of TAU-bench Airline is significantly lower than the other two models, especially at lower model numbers.