\n
## Line Chart: Model Performance Comparison
### Overview
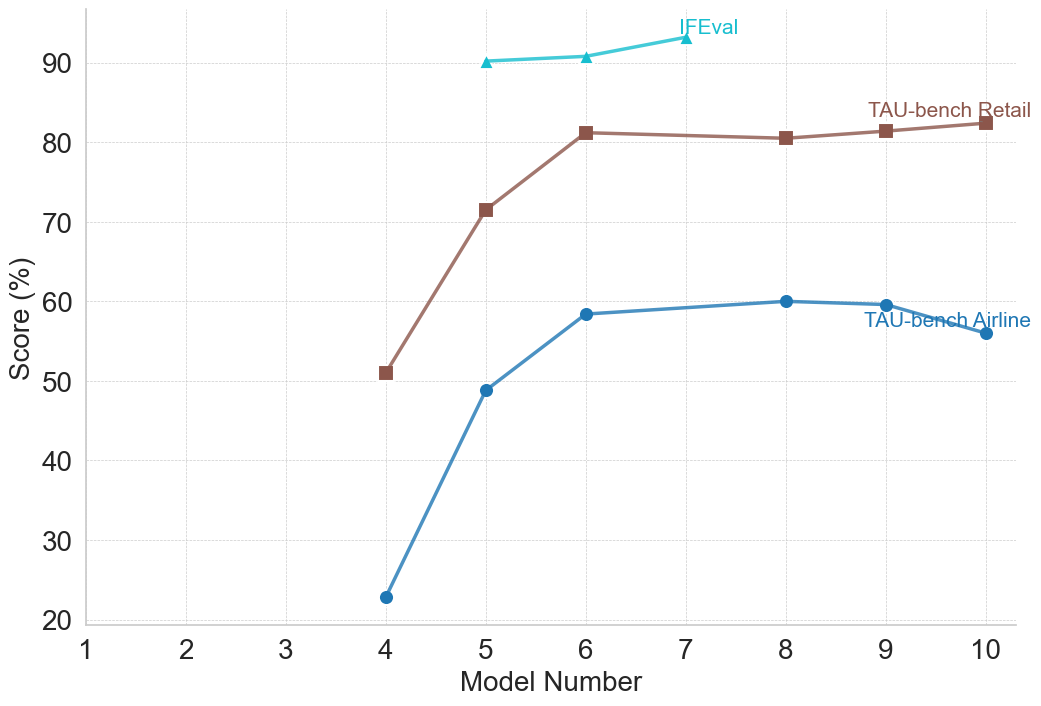
This line chart compares the performance of different models (numbered 1 through 10) across three evaluation metrics: IFEval, TAU-bench Retail, and TAU-bench Airline. The y-axis represents the score in percentage (%), while the x-axis represents the model number.
### Components/Axes
* **X-axis:** "Model Number" ranging from 1 to 10.
* **Y-axis:** "Score (%)" ranging from 20 to 90.
* **Lines/Series:**
* IFEval (Light Blue)
* TAU-bench Retail (Dark Brown)
* TAU-bench Airline (Gray)
* **Legend:** Located in the top-right corner, associating colors with evaluation metrics.
### Detailed Analysis
* **IFEval (Light Blue):** The line starts at approximately 23% at Model 4, rises sharply to around 88% at Model 6, and then plateaus, remaining around 90% for Models 6 through 10.
* Model 4: ~23%
* Model 5: ~57%
* Model 6: ~88%
* Model 7: ~90%
* Model 8: ~90%
* Model 9: ~90%
* Model 10: ~90%
* **TAU-bench Retail (Dark Brown):** The line starts at approximately 51% at Model 4, increases to around 73% at Model 5, reaches a peak of approximately 81% at Model 6, and then remains relatively stable around 80% for Models 6 through 10.
* Model 4: ~51%
* Model 5: ~73%
* Model 6: ~81%
* Model 7: ~80%
* Model 8: ~80%
* Model 9: ~80%
* Model 10: ~80%
* **TAU-bench Airline (Gray):** The line starts at approximately 50% at Model 4, increases to around 58% at Model 5, rises to approximately 62% at Model 6, and then plateaus around 61-62% for Models 6 through 10.
* Model 4: ~50%
* Model 5: ~58%
* Model 6: ~62%
* Model 7: ~62%
* Model 8: ~61%
* Model 9: ~61%
* Model 10: ~61%
### Key Observations
* IFEval shows the most significant improvement in performance as the model number increases, reaching a high score and then stabilizing.
* TAU-bench Retail also shows improvement, but the gains are less dramatic than IFEval.
* TAU-bench Airline exhibits the smallest improvement, with a relatively flat line indicating minimal performance change across models.
* All three metrics show a substantial jump in performance between Model 5 and Model 6.
### Interpretation
The data suggests that models 6 through 10 achieve a high level of performance on the IFEval metric, indicating a significant breakthrough in that area. While TAU-bench Retail also benefits from model improvements, the gains are more moderate. TAU-bench Airline shows the least sensitivity to model changes, suggesting that the models may have reached a performance ceiling for this specific evaluation task. The sharp increase in all metrics between Model 5 and Model 6 could indicate a critical architectural change or training data update that significantly improved the models' capabilities. The plateauing of the lines after Model 6 suggests diminishing returns from further model refinements, at least within the scope of these evaluation metrics. The differences in performance across the three metrics also suggest that the models excel at certain tasks (as measured by IFEval) but are less effective at others (TAU-bench Airline).