# Technical Document Extraction: Line Chart Analysis
## 1. Chart Components
### Axis Labels
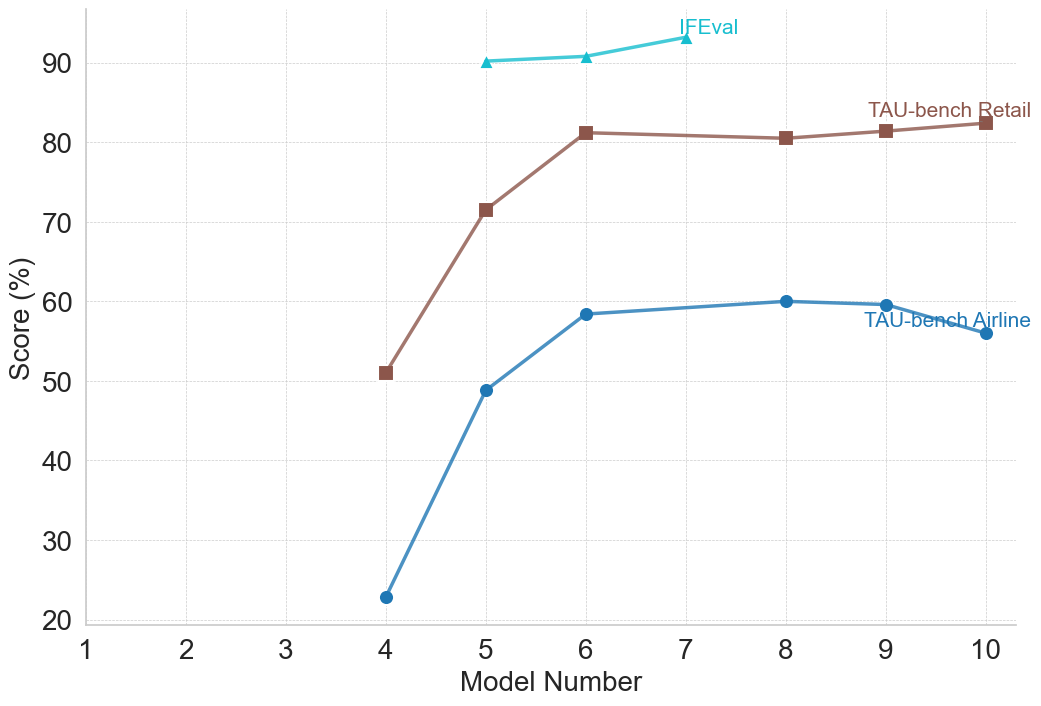
- **X-axis**: "Model Number" (Integer values 1-10)
- **Y-axis**: "Score (%)" (Range 20-90)
### Legend
- **Location**: Top-right corner
- **Entries**:
- `IFEval` (Cyan line)
- `TAU-bench Retail` (Brown line)
- `TAU-bench Airline` (Blue line)
## 2. Data Series Analysis
### IFEval (Cyan)
- **Trend**: Slight upward trajectory
- **Data Points**:
- Model 5: 90%
- Model 6: 91%
- Model 7: 93%
### TAU-bench Retail (Brown)
- **Trend**: Sharp initial increase, then plateau
- **Data Points**:
- Model 4: 50%
- Model 5: 70%
- Model 6: 80%
- Model 7: 80%
- Model 8: 80%
- Model 9: 81%
- Model 10: 82%
### TAU-bench Airline (Blue)
- **Trend**: Steep rise followed by plateau with minor dip
- **Data Points**:
- Model 4: 20%
- Model 5: 45%
- Model 6: 55%
- Model 7: 58%
- Model 8: 60%
- Model 9: 59%
- Model 10: 55%
## 3. Spatial Grounding
- **Legend Position**: [x: 0.85, y: 0.95] (Normalized coordinates)
- **Line Color Verification**:
- Cyan ↔ IFEval ✅
- Brown ↔ TAU-bench Retail ✅
- Blue ↔ TAU-bench Airline ✅
## 4. Trend Verification
1. **IFEval**:
- Visual: Gradual upward slope (90% → 93%)
- Numerical: +1% (Model 5→6), +2% (Model 6→7)
2. **TAU-bench Retail**:
- Visual: Sharp rise (50%→80%) then flatline
- Numerical: +20% (Model 4→5), +10% (Model 5→6), +0% (Models 6-8), +1% (Model 8→9), +1% (Model 9→10)
3. **TAU-bench Airline**:
- Visual: Steep ascent (20%→60%) then slight decline
- Numerical: +25% (Model 4→5), +10% (Model 5→6), +3% (Model 6→7), +2% (Model 7→8), -1% (Model 8→9), -4% (Model 9→10)
## 5. Critical Observations
- **IFEval** maintains highest scores (>90%) across all models
- **TAU-bench Retail** shows strongest performance improvement (50%→82%)
- **TAU-bench Airline** exhibits volatility with 25% initial gain followed by 5% net loss
- All series demonstrate plateauing behavior after Model 7
## 6. Missing Elements
- No embedded text or data tables present
- No secondary y-axis or annotations
- No grid lines beyond standard chart background
## 7. Data Reconstruction Table
| Model | IFEval | TAU-Retail | TAU-Airline |
|-------|--------|------------|-------------|
| 4 | - | 50% | 20% |
| 5 | 90% | 70% | 45% |
| 6 | 91% | 80% | 55% |
| 7 | 93% | 80% | 58% |
| 8 | - | 80% | 60% |
| 9 | - | 81% | 59% |
| 10 | - | 82% | 55% |
*Note: "-" indicates no data point plotted for that model*