\n
## Bar Chart: Rouge-L Scores for Different CogRAG Models
### Overview
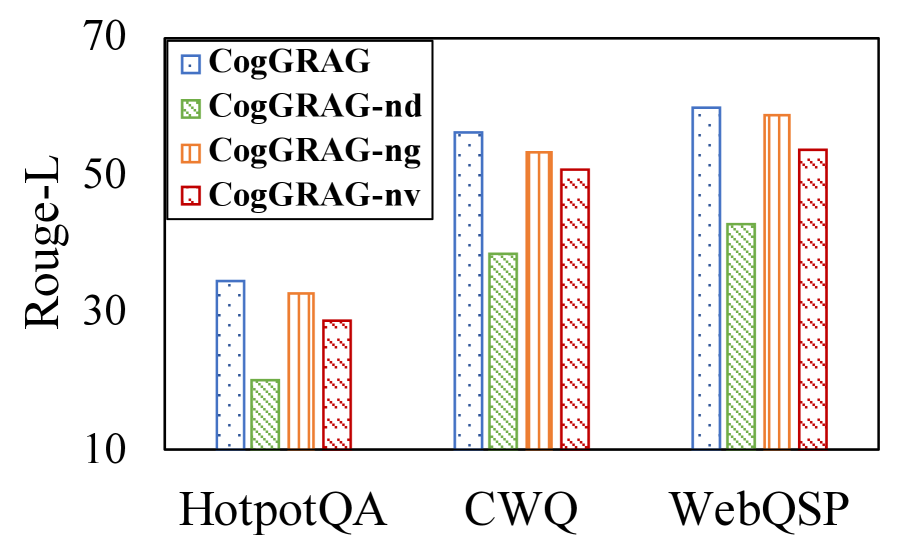
This bar chart compares the Rouge-L scores of four different CogRAG models (CogRAG, CogRAG-nd, CogRAG-ng, and CogRAG-nv) across three datasets: HotpotQA, CWQ, and WebQSP. The Rouge-L score is a metric used to evaluate the quality of text summarization or generation.
### Components/Axes
* **X-axis:** Datasets - HotpotQA, CWQ, WebQSP
* **Y-axis:** Rouge-L Score (ranging from approximately 10 to 70)
* **Legend:**
* Blue: CogRAG
* Light Green: CogRAG-nd
* Orange: CogRAG-ng
* Red: CogRAG-nv
### Detailed Analysis
The chart consists of three groups of four bars, one group for each dataset. Each bar represents the Rouge-L score for a specific CogRAG model on that dataset.
**HotpotQA:**
* CogRAG (Blue): Approximately 34.
* CogRAG-nd (Light Green): Approximately 24.
* CogRAG-ng (Orange): Approximately 32.
* CogRAG-nv (Red): Approximately 29.
**CWQ:**
* CogRAG (Blue): Approximately 53.
* CogRAG-nd (Light Green): Approximately 42.
* CogRAG-ng (Orange): Approximately 50.
* CogRAG-nv (Red): Approximately 46.
**WebQSP:**
* CogRAG (Blue): Approximately 57.
* CogRAG-nd (Light Green): Approximately 40.
* CogRAG-ng (Orange): Approximately 54.
* CogRAG-nv (Red): Approximately 49.
### Key Observations
* CogRAG consistently achieves the highest Rouge-L scores across all three datasets.
* CogRAG-nd generally has the lowest Rouge-L scores.
* The performance differences between CogRAG-ng and CogRAG-nv are relatively small.
* The Rouge-L scores are generally higher on the CWQ and WebQSP datasets compared to HotpotQA.
### Interpretation
The data suggests that the base CogRAG model performs best in terms of Rouge-L score across all tested datasets. The variations (CogRAG-nd, CogRAG-ng, CogRAG-nv) appear to represent different modifications or configurations of the base model, with CogRAG-nd consistently underperforming. The higher scores on CWQ and WebQSP might indicate that these datasets are more amenable to the type of text generation or summarization that CogRAG is designed for, or that the datasets themselves are less challenging. The Rouge-L metric is sensitive to n-gram overlap, so the differences in scores likely reflect variations in the fluency, relevance, and overall quality of the generated text. Further investigation would be needed to understand the specific changes implemented in each variation of CogRAG and their impact on performance.