## Line Charts: Accuracy and Loss vs. Number of Decoded Paths
### Overview
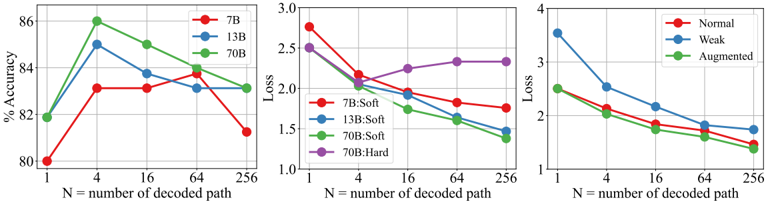
The image presents three line charts comparing the performance of different models based on accuracy and loss, plotted against the number of decoded paths (N). The first chart shows the accuracy of 7B, 13B, and 70B models. The second chart shows the loss of 7B:Soft, 13B:Soft, 70B:Soft, and 70B:Hard models. The third chart shows the loss of Normal, Weak, and Augmented models.
### Components/Axes
**Chart 1: Accuracy vs. Number of Decoded Paths**
* **Y-axis:** "% Accuracy", ranging from 80% to 86% with tick marks at each integer value.
* **X-axis:** "N = number of decoded path", with values 1, 4, 16, 64, and 256.
* **Legend:** Located at the top-right of the chart.
* Red line: "7B"
* Blue line: "13B"
* Green line: "70B"
**Chart 2: Loss vs. Number of Decoded Paths**
* **Y-axis:** "Loss", ranging from 1.0 to 3.0.
* **X-axis:** "N = number of decoded path", with values 1, 4, 16, 64, and 256.
* **Legend:** Located at the center-right of the chart.
* Red line: "7B:Soft"
* Blue line: "13B:Soft"
* Green line: "70B:Soft"
* Purple line: "70B:Hard"
**Chart 3: Loss vs. Number of Decoded Paths**
* **Y-axis:** "Loss", ranging from approximately 1 to 4.
* **X-axis:** "N = number of decoded path", with values 1, 4, 16, 64, and 256.
* **Legend:** Located at the top-right of the chart.
* Red line: "Normal"
* Blue line: "Weak"
* Green line: "Augmented"
### Detailed Analysis
**Chart 1: Accuracy vs. Number of Decoded Paths**
* **7B (Red):** Starts at approximately 80% accuracy at N=1, increases to approximately 83% at N=4, remains relatively constant at N=16 and N=64, then decreases to approximately 81% at N=256.
* **13B (Blue):** Starts at approximately 82% accuracy at N=1, increases to approximately 85% at N=4, decreases to approximately 84% at N=16, remains relatively constant at N=64, then decreases to approximately 83% at N=256.
* **70B (Green):** Starts at approximately 82% accuracy at N=1, increases to approximately 86% at N=4, decreases to approximately 85% at N=16, remains relatively constant at N=64, then decreases to approximately 84% at N=256.
**Chart 2: Loss vs. Number of Decoded Paths**
* **7B:Soft (Red):** Starts at approximately 2.7 loss at N=1, decreases to approximately 2.1 at N=4, decreases to approximately 1.9 at N=16, remains relatively constant at N=64, then decreases to approximately 1.7 at N=256.
* **13B:Soft (Blue):** Starts at approximately 2.5 loss at N=1, decreases to approximately 2.2 at N=4, decreases to approximately 2.0 at N=16, remains relatively constant at N=64, then decreases to approximately 1.8 at N=256.
* **70B:Soft (Green):** Starts at approximately 2.6 loss at N=1, decreases to approximately 2.2 at N=4, decreases to approximately 2.1 at N=16, remains relatively constant at N=64, then decreases to approximately 1.5 at N=256.
* **70B:Hard (Purple):** Starts at approximately 2.4 loss at N=1, decreases to approximately 2.1 at N=4, increases to approximately 2.2 at N=16, remains relatively constant at N=64 and N=256.
**Chart 3: Loss vs. Number of Decoded Paths**
* **Normal (Red):** Starts at approximately 2.4 loss at N=1, decreases to approximately 2.2 at N=4, decreases to approximately 1.9 at N=16, decreases to approximately 1.7 at N=64, then decreases to approximately 1.6 at N=256.
* **Weak (Blue):** Starts at approximately 3.7 loss at N=1, decreases to approximately 2.6 at N=4, decreases to approximately 2.2 at N=16, decreases to approximately 1.9 at N=64, then decreases to approximately 1.8 at N=256.
* **Augmented (Green):** Starts at approximately 2.6 loss at N=1, decreases to approximately 2.1 at N=4, decreases to approximately 1.8 at N=16, decreases to approximately 1.7 at N=64, then decreases to approximately 1.5 at N=256.
### Key Observations
* In the first chart, the 70B model generally has the highest accuracy, especially at N=4.
* In the second chart, the 70B:Soft model has the lowest loss at N=256. The 70B:Hard model has a different trend, with loss increasing slightly after N=4.
* In the third chart, the "Weak" model starts with the highest loss but converges towards the "Normal" and "Augmented" models as N increases.
### Interpretation
The charts suggest that increasing the number of decoded paths (N) initially improves both accuracy and loss for most models. However, after a certain point (around N=4 to N=16), the gains diminish, and in some cases, performance decreases slightly. The 70B model generally outperforms the 7B and 13B models in terms of accuracy. The "Soft" versions of the models tend to have lower loss than the "Hard" version. The "Augmented" model shows a consistent decrease in loss as N increases, suggesting that data augmentation can improve model performance. The "Weak" model's high initial loss indicates that it may require more decoded paths to achieve comparable performance to the "Normal" and "Augmented" models.