## Line Graphs: Model Performance vs. Decoded Paths
### Overview
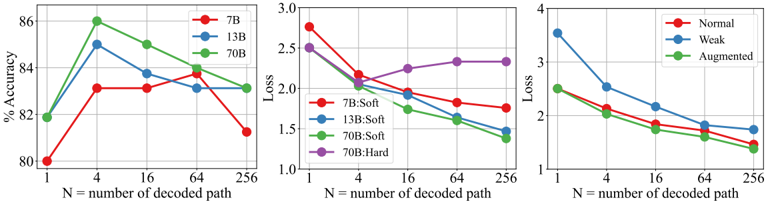
The image contains three line graphs comparing model performance metrics (accuracy and loss) across different model sizes (7B, 13B, 70B), training methods (Soft vs. Hard), and data types (Normal, Weak, Augmented). Each graph plots performance against the number of decoded paths (N = 1, 4, 16, 64, 256).
---
### Components/Axes
1. **Left Graph: Accuracy (%)**
- **X-axis**: Number of decoded paths (N) – logarithmic scale (1, 4, 16, 64, 256).
- **Y-axis**: Accuracy (%) – linear scale (80–86%).
- **Legend**:
- Red: 7B
- Blue: 13B
- Green: 70B
2. **Middle Graph: Loss**
- **X-axis**: Number of decoded paths (N) – same as above.
- **Y-axis**: Loss – linear scale (1.0–3.0).
- **Legend**:
- Red: 7B:Soft
- Blue: 13B:Soft
- Green: 70B:Soft
- Purple: 70B:Hard
3. **Right Graph: Loss**
- **X-axis**: Number of decoded paths (N) – same as above.
- **Y-axis**: Loss – linear scale (1.0–4.0).
- **Legend**:
- Red: Normal
- Blue: Weak
- Green: Augmented
---
### Detailed Analysis
#### Left Graph: Accuracy
- **7B (Red)**: Peaks at 84% accuracy at N=4, then declines to 81% at N=256.
- **13B (Blue)**: Peaks at 85% at N=4, then drops to 83% at N=256.
- **70B (Green)**: Peaks at 86% at N=4, stabilizes at 84% at N=256.
#### Middle Graph: Loss (Soft Training)
- **7B:Soft (Red)**: Starts at 2.5 loss at N=1, decreases to 1.8 at N=256.
- **13B:Soft (Blue)**: Starts at 2.4, decreases to 1.6 at N=256.
- **70B:Soft (Green)**: Starts at 2.2, decreases to 1.5 at N=256.
- **70B:Hard (Purple)**: Starts at 2.5, decreases to 1.8 at N=256.
#### Right Graph: Loss (Data Types)
- **Normal (Red)**: Starts at 3.5 loss at N=1, decreases to 2.0 at N=256.
- **Weak (Blue)**: Starts at 3.8, decreases to 1.8 at N=256.
- **Augmented (Green)**: Starts at 2.8, decreases to 1.6 at N=256.
---
### Key Observations
1. **Accuracy Trends**:
- All models show peak accuracy at N=4, followed by a decline. The 70B model maintains higher accuracy across all N values.
- The 7B model’s accuracy drops sharply after N=4, suggesting overfitting or diminishing returns.
2. **Loss Trends**:
- Loss decreases with increasing N for all models and training methods. The 70B:Soft model achieves the lowest loss (1.5 at N=256).
- The 70B:Hard model has higher loss than 70B:Soft but still outperforms smaller models.
3. **Data Type Impact**:
- Augmented data (Green) maintains the lowest loss across all N values, indicating better generalization.
- Weak data (Blue) shows the steepest loss reduction, suggesting it benefits more from increased N.
---
### Interpretation
- **Model Size vs. Performance**: Larger models (70B) achieve higher accuracy and lower loss, but require more computational resources. The 7B model’s performance degrades significantly at higher N, highlighting scalability challenges.
- **Training Methods**: Soft training (70B:Soft) yields lower loss than Hard training (70B:Hard), suggesting softer optimization improves efficiency.
- **Data Augmentation**: Augmented data (Green) reduces loss more effectively than Normal or Weak data, implying robustness to data variability.
- **Anomalies**: The 7B model’s accuracy drop after N=4 is unusual, as larger models maintain performance. This may indicate architectural limitations or overfitting in smaller models.
The data underscores the trade-offs between model size, training strategies, and data quality in optimizing performance. Augmented data and larger models (70B) appear most effective, but practical deployment must balance resource constraints.