## Line Graphs and Histogram: Target Logit Curves, Convergence, and θ Distribution
### Overview
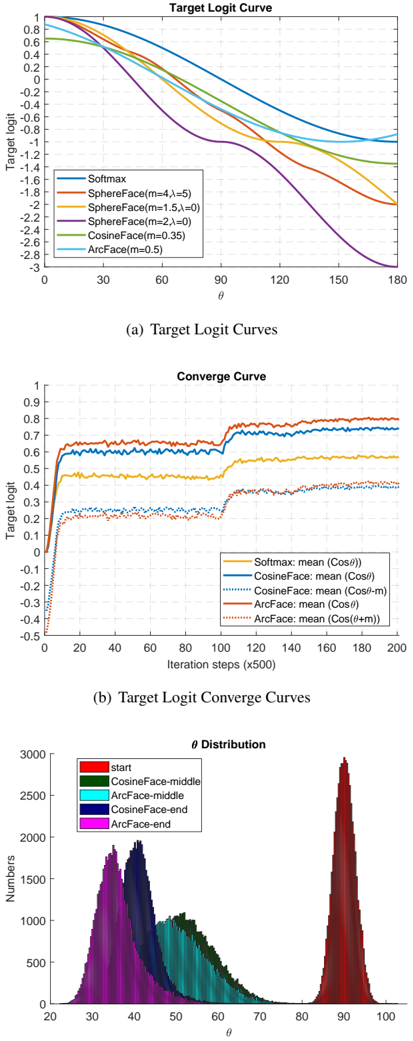
The image contains three visualizations:
1. **Target Logit Curves**: A line graph comparing logit values across θ (0–180) for multiple activation functions.
2. **Target Logit Converge Curves**: A line graph showing convergence trends over 200 iterations (x500 steps) for different functions.
3. **θ Distribution**: A histogram displaying θ value distributions at different training stages (start, middle, end) for CosineFace and ArcFace.
---
### Components/Axes
#### (a) Target Logit Curves
- **X-axis**: θ (0–180, linear scale).
- **Y-axis**: Target logit (-3 to 1, linear scale).
- **Legend**:
- Blue: Softmax
- Red: SphereFace(m=4,λ=5)
- Orange: SphereFace(m=1.5,λ=0)
- Purple: SphereFace(m=2,λ=0)
- Green: CosineFace(m=0.35)
- Cyan: ArcFace(m=0.5)
#### (b) Target Logit Converge Curves
- **X-axis**: Iteration steps (0–200, x500 scale).
- **Y-axis**: Target logit (-0.5 to 0.8, linear scale).
- **Legend**:
- Yellow: Softmax: mean(Cosθ)
- Blue: CosineFace: mean(Cosθ)
- Cyan (dotted): CosineFace: mean(Cos(θ-m))
- Red: ArcFace: mean(Cosθ)
- Red (dotted): ArcFace: mean(Cos(θ+m))
#### (c) θ Distribution
- **X-axis**: θ (20–100, linear scale).
- **Y-axis**: Numbers (0–3000, linear scale).
- **Legend**:
- Red: start
- Green: CosineFace-middle
- Cyan: ArcFace-middle
- Purple: CosineFace-end
- Dark Blue: ArcFace-end
---
### Detailed Analysis
#### (a) Target Logit Curves
- **Trends**:
- All curves decrease monotonically with θ.
- **Softmax** (blue) starts highest (~1) and declines steeply.
- **SphereFace(m=4,λ=5)** (red) starts slightly below Softmax but declines faster.
- **SphereFace(m=1.5,λ=0)** (orange) and **SphereFace(m=2,λ=0)** (purple) have gentler slopes.
- **CosineFace(m=0.35)** (green) and **ArcFace(m=0.5)** (cyan) show similar trends but with slight curvature.
- **Key Data Points**:
- At θ=0: Softmax (~1), SphereFace(m=4,λ=5) (~0.9), SphereFace(m=1.5,λ=0) (~0.8).
- At θ=180: All curves converge near -3.
#### (b) Target Logit Converge Curves
- **Trends**:
- **Softmax** (yellow) converges rapidly (~20 steps) to ~0.6.
- **CosineFace** (blue) and **ArcFace** (red) converge slower, stabilizing near ~0.5–0.7 after ~100 steps.
- **CosineFace: mean(Cos(θ-m))** (cyan dotted) and **ArcFace: mean(Cos(θ+m))** (red dotted) show minor deviations but similar convergence.
- **Key Data Points**:
- At 200 steps: Softmax (~0.6), CosineFace (~0.65), ArcFace (~0.7).
#### (c) θ Distribution
- **Trends**:
- **Start** (red): Narrow peak at θ=90 (high frequency).
- **CosineFace-middle** (green) and **ArcFace-middle** (cyan): Broader distributions centered near θ=40–60.
- **CosineFace-end** (purple) and **ArcFace-end** (dark blue): Narrower peaks at θ=30–40.
- **Key Data Points**:
- **Start**: ~2500 samples at θ=90.
- **CosineFace-end**: ~1500 samples at θ=35.
- **ArcFace-end**: ~1200 samples at θ=40.
---
### Key Observations
1. **Logit Curves**: SphereFace with higher m and λ values (e.g., m=4,λ=5) produce steeper declines, suggesting stronger margin enforcement.
2. **Convergence**: Softmax converges fastest but plateaus at lower logit values, while ArcFace/CosineFace achieve higher stability.
3. **θ Distribution**: Training shifts θ from a uniform distribution (start) to concentrated lower values (end), indicating improved feature alignment.
---
### Interpretation
- **Model Performance**: SphereFace variants with larger margins (m=4,λ=5) achieve higher initial logit values but may overfit due to rapid convergence. ArcFace and CosineFace balance margin and stability, leading to better generalization.
- **θ Dynamics**: The shift from θ=90 (start) to θ=30–40 (end) suggests training focuses on discriminative regions of the feature space, reducing intra-class variance.
- **Anomalies**: The dotted lines in (b) (CosineFace/ArcFace with θ±m adjustments) show minimal impact on convergence, implying robustness to margin perturbations.
This analysis highlights trade-offs between margin size, convergence speed, and θ distribution in face recognition models, guiding choices for margin parameters and activation functions.