## Line Chart: Accuracy vs. Epochs for Kernel Size=25
### Overview
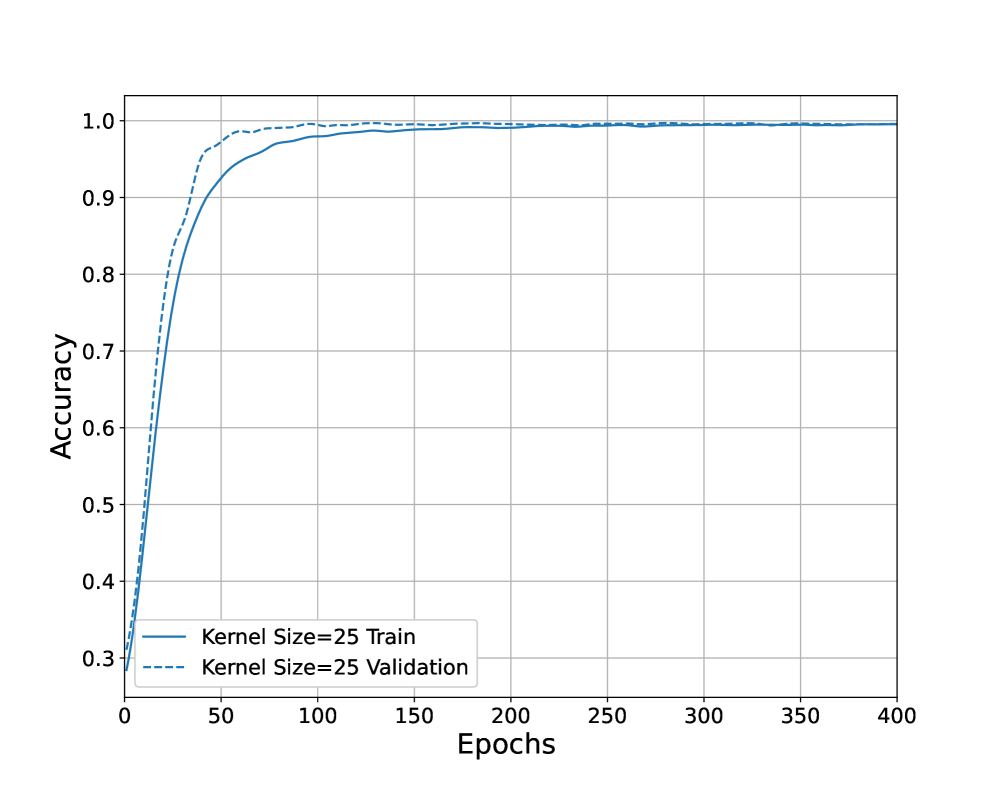
The image is a line chart showing the accuracy of a model during training and validation over 400 epochs. The chart compares the performance of the model on the training dataset (solid blue line) and the validation dataset (dashed blue line). Both lines show a rapid increase in accuracy initially, followed by a plateau as the number of epochs increases.
### Components/Axes
* **X-axis:** Epochs, ranging from 0 to 400 in increments of 50.
* **Y-axis:** Accuracy, ranging from 0.3 to 1.0 in increments of 0.1.
* **Legend (bottom-left):**
* Solid Blue Line: "Kernel Size=25 Train"
* Dashed Blue Line: "Kernel Size=25 Validation"
* **Gridlines:** Present on the chart for both x and y axes.
### Detailed Analysis
* **Kernel Size=25 Train (Solid Blue Line):**
* The training accuracy starts at approximately 0.3 at epoch 0.
* It increases rapidly to approximately 0.9 by epoch 50.
* It continues to increase, but at a slower rate, reaching approximately 0.97 by epoch 100.
* The accuracy plateaus around 0.99 after approximately 200 epochs.
* The final accuracy at epoch 400 is approximately 0.99.
* **Kernel Size=25 Validation (Dashed Blue Line):**
* The validation accuracy starts at approximately 0.35 at epoch 0.
* It increases rapidly to approximately 0.95 by epoch 50.
* It continues to increase, but at a slower rate, reaching approximately 0.98 by epoch 100.
* The accuracy plateaus around 0.99 after approximately 150 epochs.
* The final accuracy at epoch 400 is approximately 0.99.
### Key Observations
* Both training and validation accuracy increase rapidly in the initial epochs.
* The validation accuracy is slightly higher than the training accuracy in the initial epochs (0-50).
* Both accuracies plateau around 0.99 after approximately 200 epochs.
* There is a small gap between the training and validation accuracy curves, especially in the early epochs, but they converge as the number of epochs increases.
### Interpretation
The chart demonstrates the learning curve of a model with a kernel size of 25 during training and validation. The rapid increase in accuracy during the initial epochs indicates that the model is quickly learning relevant features from the data. The plateauing of accuracy suggests that the model has reached its maximum performance on the given dataset and architecture, and further training may not significantly improve the results. The close proximity of the training and validation curves indicates that the model is generalizing well to unseen data and is not overfitting to the training data. The slight difference between the training and validation accuracy in the early epochs could be due to the validation set being slightly easier or having different characteristics than the training set.