## Line Chart: Accuracy vs. Epochs for Kernel Size 25
### Overview
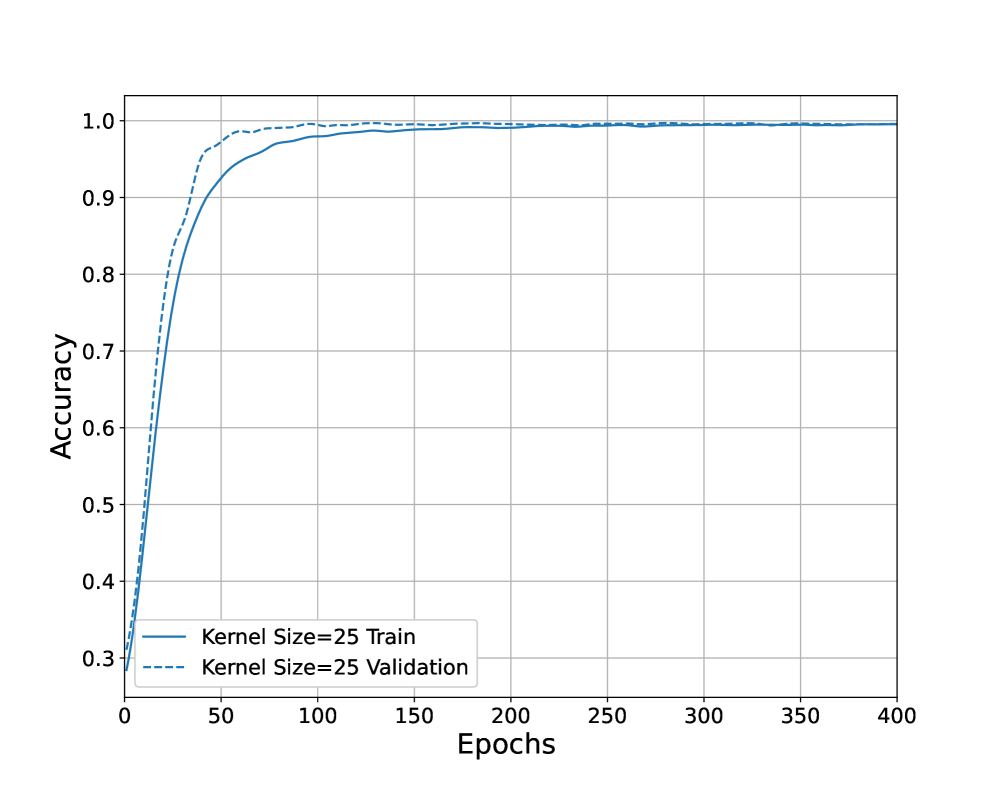
This image displays a line chart illustrating the accuracy of a model over a number of epochs. Two data series are plotted: "Kernel Size=25 Train" and "Kernel Size=25 Validation". Both series show a rapid increase in accuracy in the initial epochs, followed by a plateau at a high accuracy level.
### Components/Axes
* **X-axis**:
* **Title**: Epochs
* **Scale**: Linear, ranging from 0 to 400.
* **Markers**: 0, 50, 100, 150, 200, 250, 300, 350, 400.
* **Y-axis**:
* **Title**: Accuracy
* **Scale**: Linear, ranging from 0.3 to 1.0.
* **Markers**: 0.3, 0.4, 0.5, 0.6, 0.7, 0.8, 0.9, 1.0.
* **Legend**:
* Located in the bottom-left quadrant of the chart.
* **"Kernel Size=25 Train"**: Represented by a solid blue line.
* **"Kernel Size=25 Validation"**: Represented by a dashed blue line.
### Detailed Analysis
**Data Series 1: Kernel Size=25 Train (Solid Blue Line)**
* **Trend**: The solid blue line shows a steep upward trend from approximately 0.3 accuracy at epoch 0. It rapidly increases, reaching around 0.95 accuracy by epoch 50. The trend then continues to rise more gradually, plateauing at approximately 1.0 accuracy by epoch 150. From epoch 150 onwards, the accuracy remains consistently at or very near 1.0.
* **Key Data Points (Approximate)**:
* Epoch 0: ~0.30
* Epoch 25: ~0.75
* Epoch 50: ~0.95
* Epoch 100: ~0.99
* Epoch 150: ~1.00
* Epoch 200: ~1.00
* Epoch 400: ~1.00
**Data Series 2: Kernel Size=25 Validation (Dashed Blue Line)**
* **Trend**: The dashed blue line also exhibits a rapid upward trend from epoch 0, starting at a slightly higher accuracy than the training data, around 0.35. It quickly climbs, reaching approximately 0.98 accuracy by epoch 50. The trend then flattens out, reaching and maintaining an accuracy of approximately 1.0 from around epoch 100 onwards.
* **Key Data Points (Approximate)**:
* Epoch 0: ~0.35
* Epoch 25: ~0.85
* Epoch 50: ~0.98
* Epoch 100: ~1.00
* Epoch 150: ~1.00
* Epoch 200: ~1.00
* Epoch 400: ~1.00
### Key Observations
* Both training and validation accuracy converge to a very high level (close to 1.0).
* The validation accuracy is consistently slightly higher than the training accuracy, especially in the initial epochs.
* Both curves reach their plateau around the same epoch range (100-150 epochs).
* The model appears to be well-trained and generalizes effectively, as indicated by the close alignment and high accuracy of both training and validation curves.
### Interpretation
The chart demonstrates the learning progress of a model with a kernel size of 25 over 400 epochs. The rapid increase in accuracy for both training and validation sets suggests that the model is effectively learning the underlying patterns in the data. The plateauing of both curves at a high accuracy level (close to 1.0) indicates that the model has converged and is performing very well.
The fact that validation accuracy is slightly higher than training accuracy, particularly in the early stages, is an interesting observation. This could suggest that the validation set might be slightly easier for the model to learn from initially, or that the regularization techniques (if any) are effectively preventing overfitting. However, the strong convergence of both curves to near-perfect accuracy implies that the model is not significantly overfitting the training data. The consistency of the accuracy at 1.0 for both sets beyond epoch 150 suggests that the model has reached its optimal performance for this configuration and dataset. This indicates a successful training run for the specified kernel size.