\n
## Line Chart: Training and Validation Accuracy vs. Epochs
### Overview
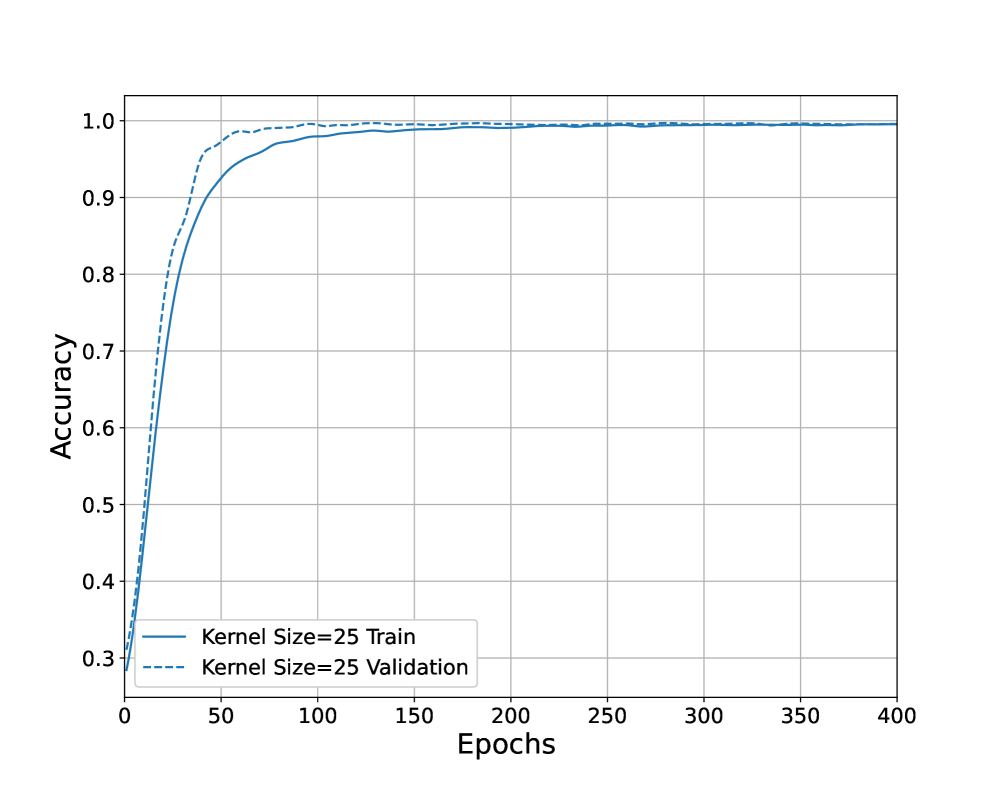
This image presents a line chart illustrating the training and validation accuracy of a model over 400 epochs. The chart visualizes how the model's performance on both the training dataset and a validation dataset changes as the training progresses.
### Components/Axes
* **X-axis:** "Epochs" - ranging from 0 to 400.
* **Y-axis:** "Accuracy" - ranging from 0.3 to 1.0.
* **Data Series 1:** "Kernel Size=25 Train" - represented by a solid blue line.
* **Data Series 2:** "Kernel Size=25 Validation" - represented by a dashed blue line.
* **Legend:** Located in the bottom-left corner of the chart, associating colors with the data series.
* **Grid:** A light gray grid is present in the background to aid in reading values.
### Detailed Analysis
**Training Accuracy (Solid Blue Line):**
The training accuracy line starts at approximately 0.32 at epoch 0. It exhibits a steep upward slope initially, rapidly increasing to around 0.95 by epoch 25. The line then plateaus, fluctuating slightly around 0.98-0.99 from epoch 50 to 400.
* Epoch 0: ~0.32
* Epoch 25: ~0.95
* Epoch 50: ~0.98
* Epoch 100: ~0.99
* Epoch 150: ~0.99
* Epoch 200: ~0.99
* Epoch 250: ~0.99
* Epoch 300: ~0.99
* Epoch 350: ~0.99
* Epoch 400: ~0.99
**Validation Accuracy (Dashed Blue Line):**
The validation accuracy line begins at approximately 0.32 at epoch 0, similar to the training accuracy. It also shows an initial steep increase, but at a slightly slower rate than the training accuracy. It reaches around 0.93 by epoch 25. The line then plateaus, fluctuating around 0.97-0.99 from epoch 50 to 400.
* Epoch 0: ~0.32
* Epoch 25: ~0.93
* Epoch 50: ~0.97
* Epoch 100: ~0.98
* Epoch 150: ~0.99
* Epoch 200: ~0.99
* Epoch 250: ~0.99
* Epoch 300: ~0.99
* Epoch 350: ~0.99
* Epoch 400: ~0.99
### Key Observations
* Both training and validation accuracy increase rapidly in the initial epochs.
* The training accuracy consistently remains slightly higher than the validation accuracy throughout the training process.
* Both lines converge and plateau after approximately 50 epochs, indicating that the model has likely reached a point of diminishing returns in terms of further training.
* There is minimal gap between the training and validation accuracy, suggesting that the model is not significantly overfitting to the training data.
### Interpretation
The chart demonstrates that the model, with a kernel size of 25, learns effectively and achieves high accuracy on both the training and validation datasets. The rapid initial increase in accuracy suggests that the model quickly identifies the underlying patterns in the data. The subsequent plateau indicates that further training does not significantly improve the model's generalization performance. The small gap between training and validation accuracy suggests a good balance between model complexity and generalization ability. The model appears to be well-trained and is unlikely to be significantly overfitting, as evidenced by the similar performance on both datasets. The choice of kernel size (25) seems appropriate for this dataset and model architecture, as it allows for effective learning without leading to excessive overfitting.