# Technical Document Extraction: Accuracy vs. Epochs Graph
## 1. Labels and Axis Titles
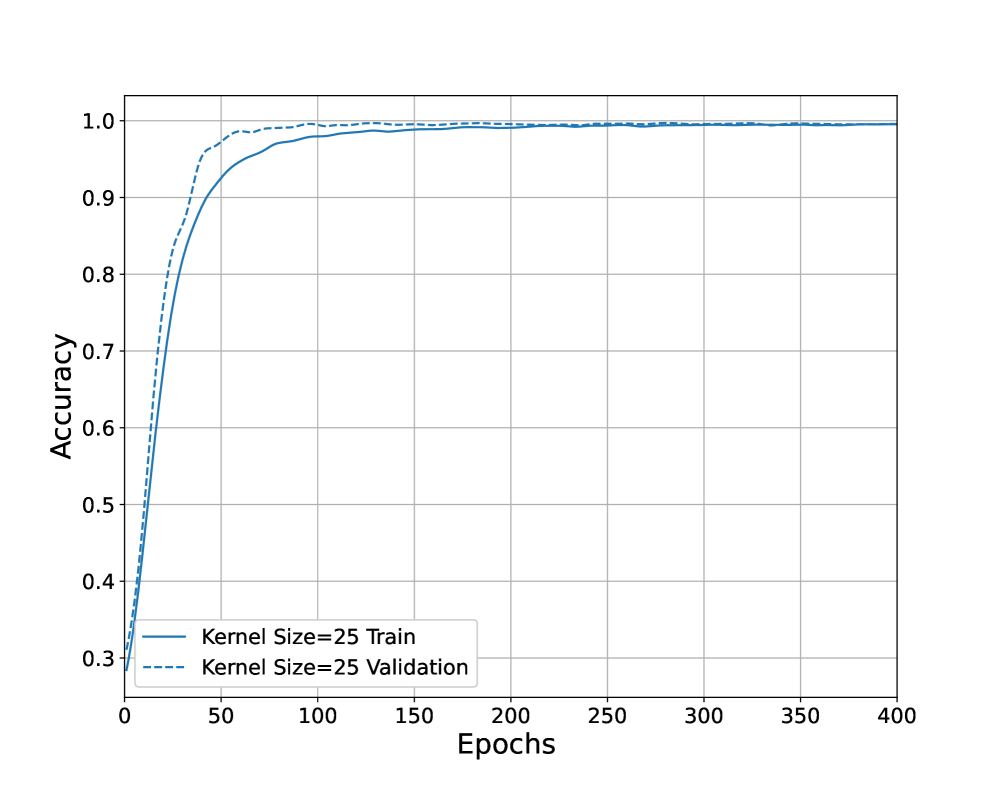
- **X-Axis**: "Epochs" (ranges from 0 to 400 in increments of 50)
- **Y-Axis**: "Accuracy" (ranges from 0.3 to 1.0 in increments of 0.1)
- **Legend**: Located at the bottom-left corner of the graph.
## 2. Legend Details
- **Line 1**: Solid blue line labeled "Kernel Size=25 Train"
- **Line 2**: Dashed blue line labeled "Kernel Size=25 Validation"
## 3. Key Trends and Data Points
### Training Accuracy (Solid Blue Line)
- **Initial Phase (0–50 epochs)**:
- Starts at 0.3 accuracy at epoch 0.
- Rises sharply to ~0.95 by epoch 50.
- **Stabilization Phase (50–400 epochs)**:
- Plateaus at ~0.995 accuracy from epoch 100 onward.
- Minor fluctuations observed between epochs 200–300 but remains near 0.995.
### Validation Accuracy (Dashed Blue Line)
- **Initial Phase (0–50 epochs)**:
- Starts at 0.3 accuracy at epoch 0.
- Rises sharply to ~0.98 by epoch 50.
- **Stabilization Phase (50–400 epochs)**:
- Plateaus at ~0.995 accuracy from epoch 100 onward.
- Slightly higher than training accuracy until epoch 150, then converges with training accuracy.
## 4. Spatial Grounding of Legend
- **Legend Position**: Bottom-left corner of the graph.
- **Color Matching**:
- Solid blue line corresponds to "Kernel Size=25 Train".
- Dashed blue line corresponds to "Kernel Size=25 Validation".
## 5. Trend Verification
- **Training Accuracy**:
- Steep upward slope from 0 to 50 epochs.
- Flat line after epoch 100.
- **Validation Accuracy**:
- Steep upward slope from 0 to 50 epochs.
- Flat line after epoch 100, with convergence to training accuracy after epoch 150.
## 6. Component Isolation
- **Header**: No explicit header text.
- **Main Chart**:
- Grid lines at every 0.1 accuracy increment and every 50 epochs.
- Two data series (train/validation) plotted on the same axes.
- **Footer**: No explicit footer text.
## 7. Data Table Reconstruction
| Epochs | Kernel Size=25 Train | Kernel Size=25 Validation |
|--------|----------------------|---------------------------|
| 0 | 0.3 | 0.3 |
| 50 | ~0.95 | ~0.98 |
| 100 | ~0.99 | ~0.99 |
| 150 | ~0.995 | ~0.995 |
| 200 | ~0.995 | ~0.995 |
| 250 | ~0.995 | ~0.995 |
| 300 | ~0.995 | ~0.995 |
| 350 | ~0.995 | ~0.995 |
| 400 | ~0.995 | ~0.995 |
## 8. Observations
- Both training and validation accuracy curves exhibit rapid improvement in the first 50 epochs, followed by stabilization.
- Validation accuracy initially outperforms training accuracy but converges to the same value after epoch 150.
- No overfitting is observed, as validation accuracy does not drop below training accuracy.
## 9. Language Declaration
- All text in the image is in English. No non-English content detected.