## Graph Diagrams: Two Example Graphs
### Overview
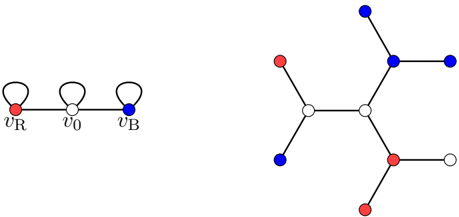
The image presents two distinct graph diagrams. The first graph, located on the left, is a simple linear graph with three nodes and self-loops on the end nodes. The second graph, on the right, is a more complex tree-like structure with multiple branches. Nodes are colored red, white, or blue.
### Components/Axes
**Left Graph:**
* Nodes: Three nodes labeled vR (red), v0 (white), and vB (blue).
* Edges: Two edges connect the nodes linearly.
* Self-Loops: vR and v0 have self-loops.
**Right Graph:**
* Nodes: Seven nodes colored red, white, or blue.
* Edges: Six edges connect the nodes in a tree-like structure.
### Detailed Analysis or ### Content Details
**Left Graph:**
* Node vR: Red node with a self-loop.
* Node v0: White node with a self-loop.
* Node vB: Blue node.
* The nodes are connected in a linear sequence: vR - v0 - vB.
**Right Graph:**
* The graph has a central structure of two white nodes connected by an edge.
* Branches extend from these central nodes.
* Node colors are distributed as follows:
* Two white nodes in the center.
* Two red nodes.
* Three blue nodes.
* One white node at the end of a branch.
* The graph has a branching structure, with no cycles.
### Key Observations
* The left graph is a simple linear graph with self-loops.
* The right graph is a more complex tree-like structure.
* Both graphs use red, white, and blue nodes.
### Interpretation
The image presents two examples of graphs with different structures and node colorings. The left graph demonstrates a simple linear structure with self-loops, while the right graph showcases a more complex tree-like structure. The use of different node colors could represent different properties or states of the nodes within the graph. The tree-like structure of the right graph suggests a hierarchical relationship between the nodes.