## Diagram: Two Graph Structures
### Overview
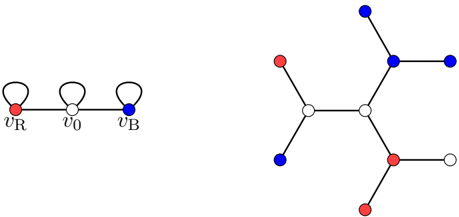
The image displays two distinct graph diagrams side-by-side on a white background. Both diagrams consist of nodes (circles) connected by edges (lines). The nodes are colored red, white, or blue. The left diagram is a simple linear chain with self-loops, while the right diagram is a more complex, tree-like structure without self-loops.
### Components/Axes
* **Node Types:** Three distinct node types are identified by color and label.
* **Red Node:** Labeled `v_R`.
* **White Node:** Labeled `v_0`.
* **Blue Node:** Labeled `v_B`.
* **Edges:** Represented by solid black lines connecting nodes.
* **Self-Loops:** Present only in the left diagram, represented by curved lines originating from and returning to the same node.
### Detailed Analysis
#### Left Diagram (Linear Chain)
* **Structure:** A horizontal chain of three nodes.
* **Node Sequence (Left to Right):**
1. **Red Node (`v_R`):** Positioned at the far left. Has a self-loop. Connected by a straight edge to the central white node.
2. **White Node (`v_0`):** Positioned in the center. Has a self-loop. Connected by straight edges to both the red node on its left and the blue node on its right.
3. **Blue Node (`v_B`):** Positioned at the far right. Has a self-loop. Connected by a straight edge to the central white node.
* **Connections:** The graph is fully connected in a line: `v_R` — `v_0` — `v_B`. Each node also has a self-loop.
#### Right Diagram (Tree Structure)
* **Structure:** A central white node with branches extending outward, forming a tree with a depth of approximately 2-3 levels.
* **Central Node:**
* **White Node:** Positioned at the geometric center of this diagram. It is the primary hub.
* **First-Level Connections (Directly connected to the central white node):**
1. **Top-Left:** A **Red Node**.
2. **Top-Right:** A **White Node**.
3. **Bottom-Right:** A **Red Node**.
4. **Bottom-Left:** A **Blue Node**.
* **Second-Level Connections (Branching from first-level nodes):**
* From the **Top-Right White Node**:
* A **Blue Node** extends upward.
* A **Blue Node** extends to the right.
* From the **Bottom-Right Red Node**:
* A **White Node** extends to the right.
* A **Red Node** extends downward.
* **Node Count & Color Distribution (Right Diagram):**
* Red Nodes: 3
* White Nodes: 3
* Blue Nodes: 4
* Total Nodes: 10
### Key Observations
1. **Color Consistency:** The labels `v_R`, `v_0`, and `v_B` are explicitly shown only on the left diagram's nodes. However, the color coding (Red, White, Blue) is consistently applied across both diagrams, suggesting the right diagram's nodes represent instances of these same types, even without explicit labels.
2. **Structural Contrast:** The left diagram is a simple, linear, and fully self-referential (self-loops) model. The right diagram is a complex, branching, hierarchical structure with no self-loops.
3. **Connectivity Pattern:** In the right diagram, white nodes (`v_0` type) appear to act as connectors or hubs. The central white node has the highest degree (4 connections). The top-right white node also has a degree of 3 (one connection to center, two to blue nodes).
4. **Spatial Layout:** The right diagram is arranged radially around the central white node, with branches extending in multiple directions (top, bottom, left, right, and diagonals).
### Interpretation
These diagrams likely illustrate concepts from graph theory, network science, or state machine modeling. The left diagram (`v_R`, `v_0`, `v_B` with self-loops) could represent a simple Markov chain or a basic state transition model where each state has a probability of remaining in itself (the self-loop) and transitioning to adjacent states.
The right diagram appears to be an **instantiation or a more complex network built from the component types defined on the left**. It demonstrates how the simple `v_R`, `v_0`, `v_B` elements can be interconnected to form a larger, non-linear system. The central white node (`v_0` type) playing a hub role suggests it might be a central server, a common protocol, or a shared resource in a network topology. The branching pattern, where red and blue nodes are often leaves (endpoints), could indicate client devices or terminal states in a process flow.
The absence of self-loops in the complex tree might imply that in this larger system, the focus is on inter-node communication rather than individual node persistence. The consistent color coding is crucial for mapping the simple model's semantics onto the complex structure, allowing one to infer the function or type of each node in the larger network based on its color.