## Diagram: Linear Pathway and Molecular Structure
### Overview
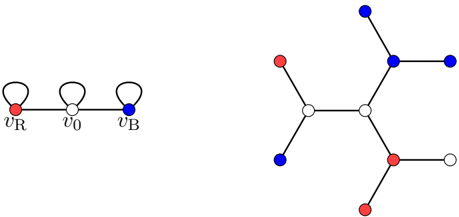
The image contains two distinct diagrams. On the left, a linear pathway with three labeled nodes (v_R, v_0, v_B) connected sequentially. On the right, a complex molecular structure with colored nodes (red, blue, white) and connecting lines, forming a hexagonal or branched network.
### Components/Axes
- **Left Diagram**:
- **Nodes**:
- `v_R` (red circle)
- `v_0` (white circle)
- `v_B` (blue circle)
- **Connections**: Straight lines between nodes, forming a linear sequence.
- **Labels**: No axis titles or legends; labels are directly attached to nodes.
- **Right Diagram**:
- **Nodes**:
- Red, blue, and white circles (no explicit labels).
- Some nodes have small loops (e.g., red node with a loop).
- **Connections**: Lines connect nodes in a non-linear, branched pattern.
- **Legend**: No explicit legend, but colors are consistent with the left diagram (red = v_R, blue = v_B, white = v_0).
### Detailed Analysis
- **Left Diagram**:
- The sequence `v_R → v_0 → v_B` suggests a directional flow or process.
- No numerical values or scales are present.
- **Right Diagram**:
- The structure resembles a molecular or chemical network, with nodes possibly representing atoms or functional groups.
- Red nodes may indicate specific roles (e.g., reactive sites), while blue and white nodes could represent different elements or states.
- No numerical data or axis markers are visible.
### Key Observations
- The left diagram is a simple linear pathway with explicit labels.
- The right diagram is a complex, non-linear structure with no explicit labels but consistent color coding.
- No numerical data, trends, or outliers are present in either diagram.
### Interpretation
- The left diagram likely represents a simplified process or sequence (e.g., a signal transduction pathway, data flow, or decision tree).
- The right diagram may depict a molecular structure (e.g., a chemical compound, protein, or network topology), where colors differentiate components (e.g., atoms, bonds, or functional groups).
- The absence of numerical data suggests the diagrams are conceptual or schematic rather than quantitative.
- The consistent color coding (red = v_R, blue = v_B, white = v_0) implies a shared framework or nomenclature between the two diagrams.
**Note**: No textual data, numerical values, or explicit legends are present in the image. The analysis is based on visual structure and inferred relationships.