## Diagram: Optical Computation with Lenses
### Overview
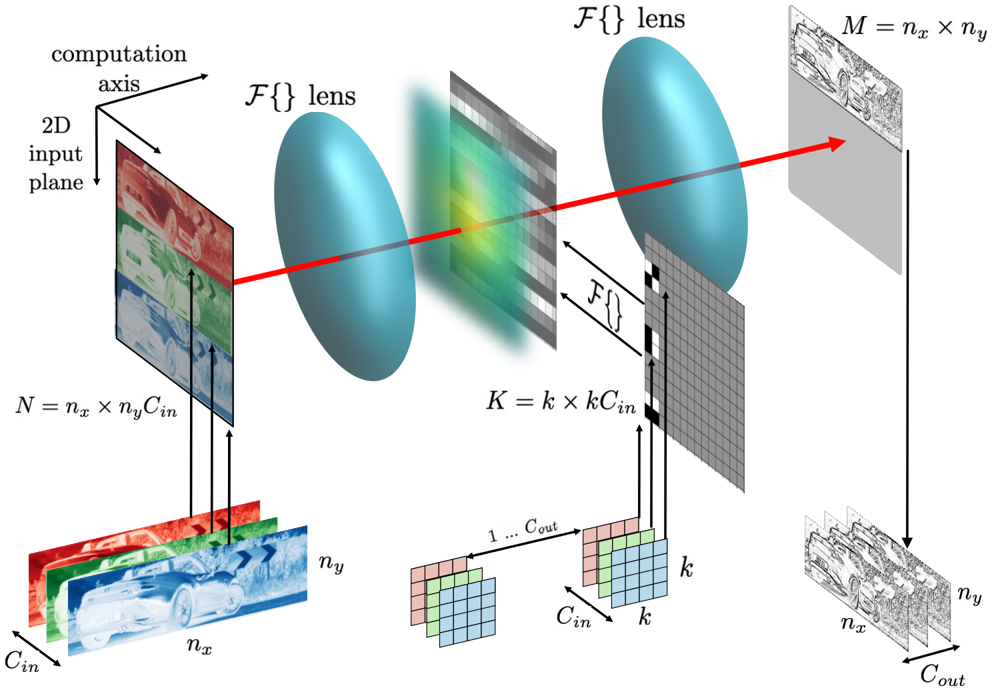
The image is a diagram illustrating an optical computation process using lenses. It shows how an input image is transformed through a series of optical elements, including lenses and intermediate representations, to produce an output image. The diagram highlights the dimensions and parameters involved in the computation.
### Components/Axes
* **Axes:**
* "computation axis" and "2D input plane" are indicated with arrows, defining the orientation of the diagram.
* **Lenses:** Two lenses are depicted, labeled as "F{} lens".
* **Input Image:**
* A stack of three images, colored red, green, and blue, representing the input channels.
* Labeled as "N = nx x ny Cin".
* Dimensions are indicated as "nx", "ny", and "Cin".
* **Intermediate Representations:**
* A grid-like representation between the lenses.
* Another grid-like representation after the second lens, labeled with "F{}".
* Labeled as "K = k x k Cin".
* Dimensions are indicated as "k" and "Cin".
* **Output Image:**
* A grayscale image on the right side.
* Labeled as "M = nx x ny".
* Dimensions are indicated as "nx", "ny", and "Cout".
* **Parameters:**
* "Cin" represents the number of input channels.
* "Cout" represents the number of output channels, indicated by "1 ... Cout".
* "nx" and "ny" represent the dimensions of the input and output images.
* "k" represents the dimensions of the intermediate grid representations.
### Detailed Analysis
* **Input Image (N):** The input image is represented as a stack of three color channels (red, green, blue). The dimensions are nx (width), ny (height), and Cin (number of input channels). The equation N = nx x ny Cin suggests that N represents the total number of input elements.
* **First Lens (F{} lens):** The first lens transforms the input image into an intermediate representation. A red ray traces the path of light through the lens.
* **Intermediate Representation (K):** This representation is a grid with dimensions k x k, and it also incorporates the number of input channels Cin. The equation K = k x k Cin suggests that K represents the total number of elements in this intermediate representation.
* **Second Lens (F{} lens):** The second lens performs another transformation on the intermediate representation.
* **Output Image (M):** The output image is a grayscale image with dimensions nx x ny. The equation M = nx x ny suggests that M represents the total number of output elements.
* **Flow:** Arrows indicate the flow of information from the input image, through the lenses and intermediate representations, to the output image.
### Key Observations
* The diagram illustrates an optical computation process where an input image is transformed into an output image using lenses and intermediate representations.
* The dimensions and parameters of the input, intermediate, and output representations are clearly labeled.
* The lenses are represented as performing some kind of transformation, denoted by "F{}".
* The number of input and output channels are represented by Cin and Cout, respectively.
### Interpretation
The diagram depicts a conceptual framework for optical computation. The lenses likely represent Fourier transform operations, as suggested by the "F{}" notation. The intermediate representations could be spatial frequency representations of the input image. The process involves transforming the input image into a different domain (e.g., frequency domain), performing some computation in that domain, and then transforming it back to the spatial domain to obtain the output image. The diagram highlights the key parameters and dimensions involved in this process, such as the number of input and output channels, and the dimensions of the intermediate representations. The use of optical elements allows for parallel processing and potentially faster computation compared to traditional digital methods. The transformation "F{}" is applied twice, suggesting a forward and inverse transform pair.