\n
## Diagram: Optical System with 2D Input Plane and Output Volume
### Overview
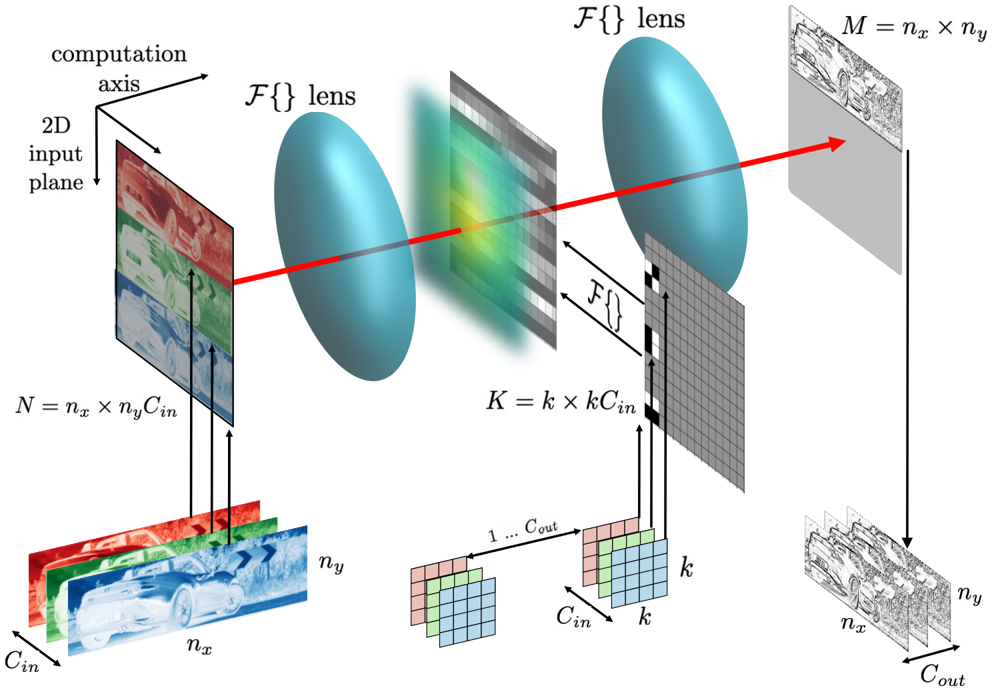
The image depicts a 3D diagram illustrating an optical system that transforms a 2D input plane into a 3D output volume. It appears to model a process akin to a Fourier transform or a similar optical imaging system. The diagram highlights the input plane, two lenses labeled "F{}" lens, an intermediate transformed plane, and the final output volume. Mathematical notations define the dimensions of each plane.
### Components/Axes
* **2D input plane:** Located at the bottom-left, representing the initial image.
* **Computation axis:** A label pointing to the vertical direction of the input plane.
* **F{} lens:** Two lens shapes positioned between the input plane and the intermediate transformed plane.
* **Intermediate transformed plane:** A rectangular prism-shaped plane between the lenses.
* **Output volume:** Located at the top-right, representing the final transformed image.
* **n<sub>x</sub>, n<sub>y</sub>, n<sub>in</sub>:** Dimensions of the input plane.
* **k, k<sub>in</sub>, c<sub>in</sub>, c<sub>out</sub>:** Dimensions related to the intermediate and output planes.
* **n<sub>x</sub>, n<sub>y</sub>:** Dimensions of the output volume.
* **N = n<sub>x</sub> x n<sub>y</sub>c<sub>in</sub>:** Equation defining the size of the input plane.
* **K = k x k c<sub>in</sub>:** Equation defining the size of the intermediate transformed plane.
* **M = n<sub>x</sub> x n<sub>y</sub>:** Equation defining the size of the output volume.
* **F{}:** Label indicating the function performed by the lenses.
* **Arrows:** Red arrows indicate the flow of information through the system.
### Detailed Analysis or Content Details
The diagram shows a transformation process. The 2D input plane, with dimensions n<sub>x</sub>, n<sub>y</sub>, and c<sub>in</sub>, is passed through two lenses labeled "F{} lens". These lenses perform a transformation, resulting in an intermediate plane with dimensions k, k, and c<sub>in</sub>. The intermediate plane is then transformed into the final output volume with dimensions n<sub>x</sub>, n<sub>y</sub>, and c<sub>out</sub>.
The input plane is visually represented as a photograph of a car. The intermediate plane shows a rainbow-like color gradient, suggesting a frequency or spectral representation. The output volume appears as a 3D representation of the input image.
The equations provided define the dimensions of each plane:
* Input plane size (N): n<sub>x</sub> multiplied by n<sub>y</sub> multiplied by c<sub>in</sub>.
* Intermediate plane size (K): k multiplied by k multiplied by c<sub>in</sub>.
* Output volume size (M): n<sub>x</sub> multiplied by n<sub>y</sub>.
### Key Observations
The diagram illustrates a process that transforms a 2D image into a 3D representation, likely involving a Fourier transform or similar optical imaging technique. The lenses play a crucial role in this transformation, and the intermediate plane represents a frequency-domain representation of the input image. The dimensions of each plane are mathematically defined, providing a quantitative understanding of the transformation process.
### Interpretation
This diagram likely represents a simplified model of an optical system used in image processing or computer vision. The "F{}" lenses could represent a Fourier transform lens, which converts a spatial representation of an image into a frequency representation. The intermediate plane then represents the frequency spectrum of the input image. The final output volume represents the reconstructed image in the spatial domain.
The use of mathematical notations suggests a focus on the quantitative aspects of the transformation. The diagram could be used to explain the principles of optical imaging, Fourier optics, or related fields. The rainbow-like color gradient in the intermediate plane suggests that the transformation involves a decomposition of the input image into its constituent frequencies. The overall system appears to be designed to capture and process information from a 2D input and represent it in a 3D output space. The diagram is a conceptual illustration rather than a precise engineering blueprint, focusing on the flow of information and the key components involved in the transformation.