\n
## Bar Chart: Latency vs. Batch Size for FP16 and w8a8
### Overview
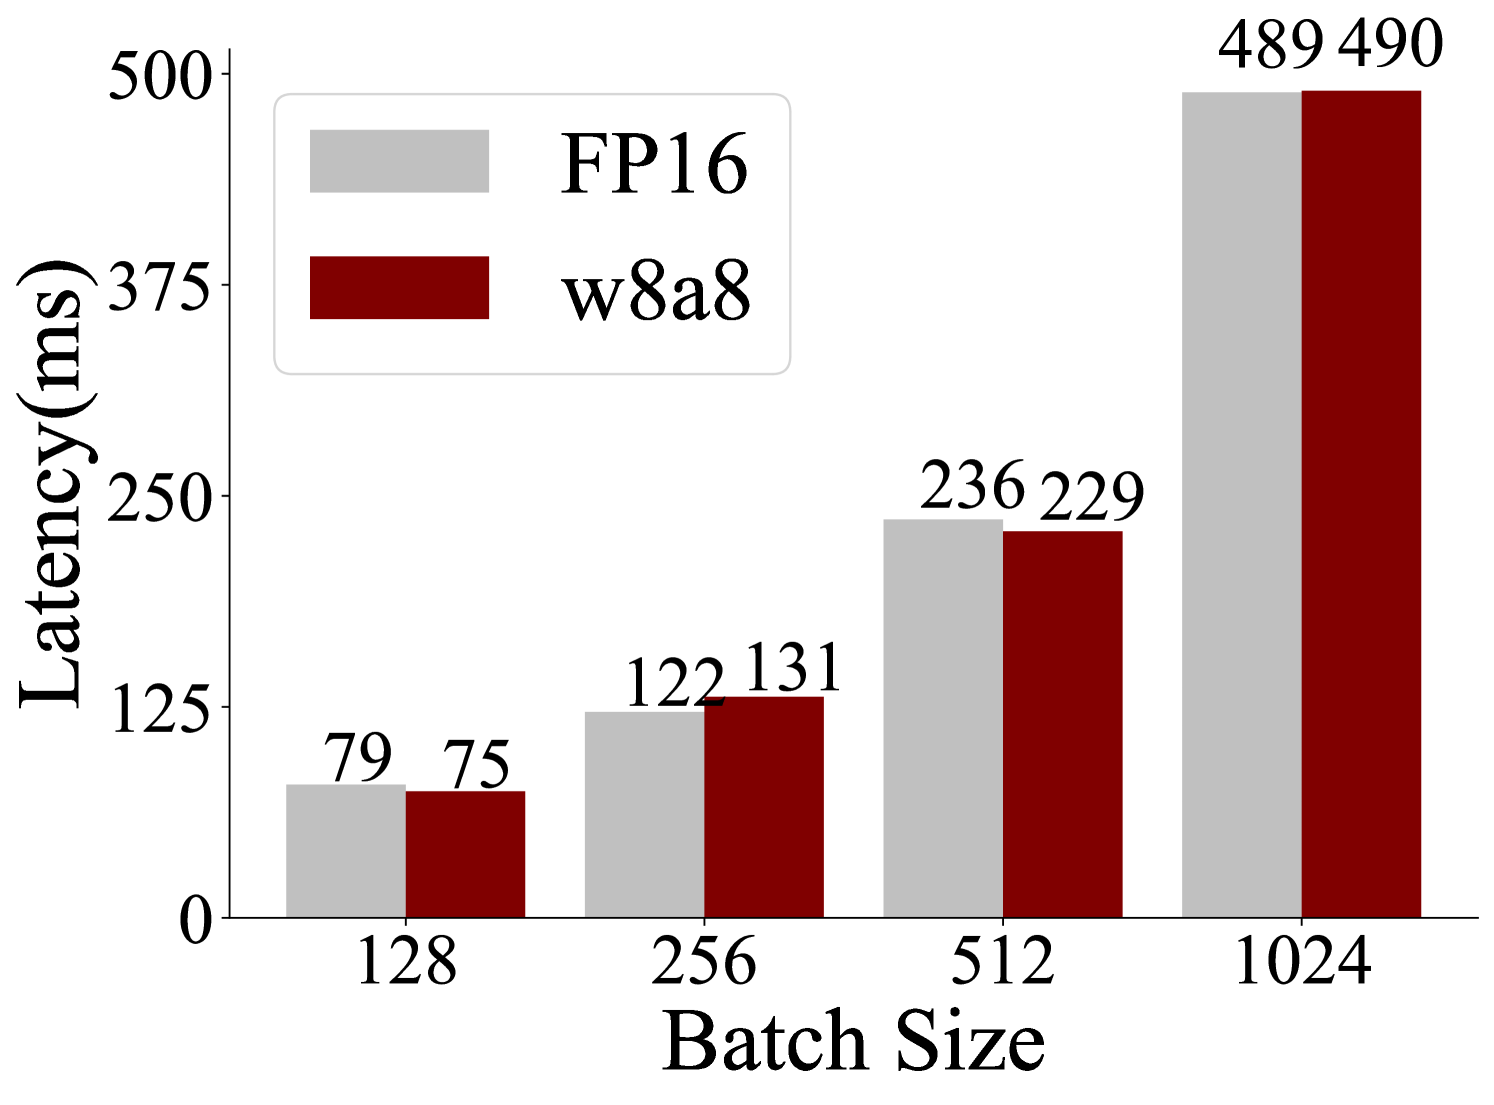
This bar chart compares the latency (in milliseconds) of two data types, FP16 and w8a8, across different batch sizes. The batch sizes are 128, 256, 512, and 1024. The chart visually represents how latency changes with increasing batch size for each data type.
### Components/Axes
* **X-axis:** Batch Size (labeled at the bottom). Markers are 128, 256, 512, and 1024.
* **Y-axis:** Latency (ms) (labeled on the left). Scale ranges from 0 to 500, with increments of 125.
* **Legend:** Located in the top-left corner.
* Light Gray: FP16
* Dark Red: w8a8
### Detailed Analysis
The chart consists of paired bars for each batch size, representing FP16 and w8a8 latency.
* **Batch Size 128:**
* FP16: Approximately 79 ms.
* w8a8: Approximately 75 ms.
* **Batch Size 256:**
* FP16: Approximately 122 ms.
* w8a8: Approximately 131 ms.
* **Batch Size 512:**
* FP16: Approximately 236 ms.
* w8a8: Approximately 229 ms.
* **Batch Size 1024:**
* FP16: Approximately 489 ms.
* w8a8: Approximately 490 ms.
Visually, the latency increases as the batch size increases for both data types. The bars for w8a8 are consistently slightly lower than those for FP16 at lower batch sizes, but converge at the highest batch size.
### Key Observations
* Latency increases almost linearly with batch size for both FP16 and w8a8.
* w8a8 generally exhibits slightly lower latency than FP16 for batch sizes of 128, 256, and 512.
* At a batch size of 1024, the latency for FP16 and w8a8 is nearly identical.
* The difference in latency between the two data types is relatively small, especially at larger batch sizes.
### Interpretation
The data suggests that w8a8 offers a slight performance advantage (lower latency) over FP16 for smaller batch sizes. However, as the batch size increases, the performance difference diminishes, and at a batch size of 1024, the latencies are practically the same. This could indicate that the overhead associated with w8a8 becomes more significant at larger batch sizes, negating its initial benefits. The chart demonstrates the trade-offs between data type precision (FP16) and computational efficiency (w8a8) in the context of batch processing. The convergence of the lines at higher batch sizes suggests a potential saturation point where the benefits of reduced precision are outweighed by other factors. This information is valuable for optimizing model deployment based on expected batch sizes and performance requirements.