\n
## Bar Chart: Latency vs. Batch Size for FP16 and w8a8 Precision
### Overview
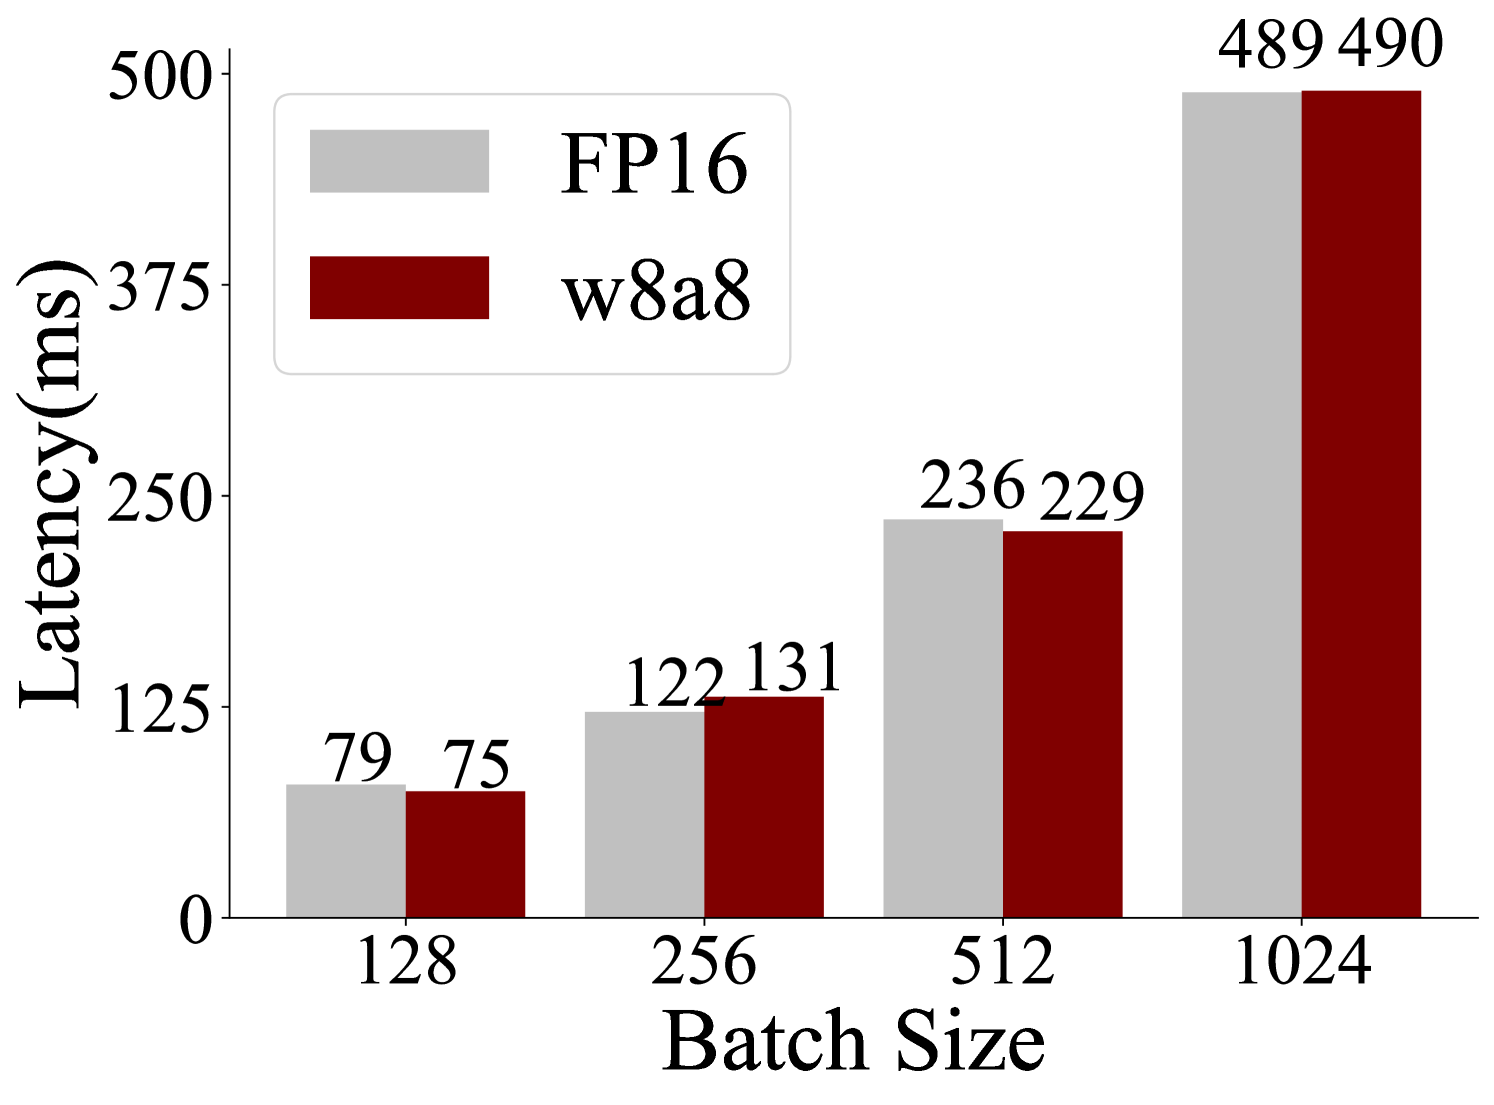
This is a grouped bar chart comparing the inference latency (in milliseconds) of two different numerical precision formats—FP16 (16-bit floating point) and w8a8 (8-bit weights and 8-bit activations)—across four different batch sizes. The chart visually demonstrates how latency scales with increasing batch size for each format.
### Components/Axes
* **Chart Type:** Grouped vertical bar chart.
* **Y-Axis (Vertical):**
* **Label:** `Latency(ms)`
* **Scale:** Linear scale from 0 to 500 ms.
* **Major Tick Marks:** 0, 125, 250, 375, 500.
* **X-Axis (Horizontal):**
* **Label:** `Batch Size`
* **Categories:** 128, 256, 512, 1024.
* **Legend:**
* **Position:** Top-left corner of the chart area.
* **Items:**
* Light gray square: `FP16`
* Dark red square: `w8a8`
* **Data Labels:** Numerical latency values are printed directly above each bar.
### Detailed Analysis
The chart presents paired bars for each batch size. The left bar (light gray) represents FP16 latency, and the right bar (dark red) represents w8a8 latency.
**Data Series & Values:**
| Batch Size | FP16 Latency (ms) | w8a8 Latency (ms) |
| :--- | :--- | :--- |
| **128** | 79 | 75 |
| **256** | 122 | 131 |
| **512** | 236 | 229 |
| **1024** | 489 | 490 |
**Trend Verification:**
* **FP16 (Light Gray Bars):** The series shows a clear, steep upward trend. Latency increases monotonically and significantly with batch size, from 79 ms at batch size 128 to 489 ms at batch size 1024.
* **w8a8 (Dark Red Bars):** This series also shows a strong upward trend. Latency increases from 75 ms at batch size 128 to 490 ms at batch size 1024.
### Key Observations
1. **Dominant Trend:** For both precision formats, latency increases approximately linearly with batch size. The jump from batch size 512 to 1024 results in roughly a doubling of latency for both.
2. **Performance Crossover:** The relative performance of the two formats changes with batch size.
* At **batch size 128**, w8a8 (75 ms) is slightly faster than FP16 (79 ms).
* At **batch size 256**, the relationship inverts, with FP16 (122 ms) becoming faster than w8a8 (131 ms).
* At **batch size 512**, w8a8 (229 ms) regains a slight lead over FP16 (236 ms).
* At **batch size 1024**, the latencies are nearly identical (489 ms vs. 490 ms), with FP16 having a negligible advantage.
3. **Magnitude of Difference:** The absolute difference in latency between the two formats is relatively small across all tested batch sizes, ranging from 4 ms to 9 ms.
### Interpretation
This chart provides a performance comparison relevant to machine learning model deployment, where choosing between higher precision (FP16) and lower precision (w8a8 quantization) involves trade-offs between accuracy, speed, and memory usage.
* **What the data suggests:** The data indicates that for this specific model and hardware configuration, the latency benefit of using w8a8 quantization over FP16 is minimal and inconsistent. The performance is highly dependent on the batch size. There is no clear, consistent "winner" in terms of raw inference speed across the tested range.
* **Relationship between elements:** The primary relationship shown is the direct, positive correlation between batch size and latency for both precision types. The secondary relationship is the comparison between the two types, which shows their performance is tightly coupled and crosses over multiple times.
* **Notable anomalies/outliers:** The most notable pattern is the inconsistency in which format is faster. The inversion at batch size 256 (where FP16 outperforms w8a8) is particularly interesting, as one might expect quantization to consistently reduce latency. This could point to specific hardware utilization characteristics, kernel optimization differences, or overheads associated with the quantization/dequantization process that become more or less prominent at different batch sizes.
* **Conclusion:** The choice between FP16 and w8a8 for this workload cannot be made on latency grounds alone based on this data. The decision would likely hinge on other factors such as model accuracy after quantization, memory footprint reduction (which w8a8 would significantly improve), and the typical batch sizes used in the production environment. The chart demonstrates that latency scaling is predictable, but the relative advantage of quantization is not guaranteed.