## Bar Chart: Latency Comparison Between FP16 and w8a8 Methods
### Overview
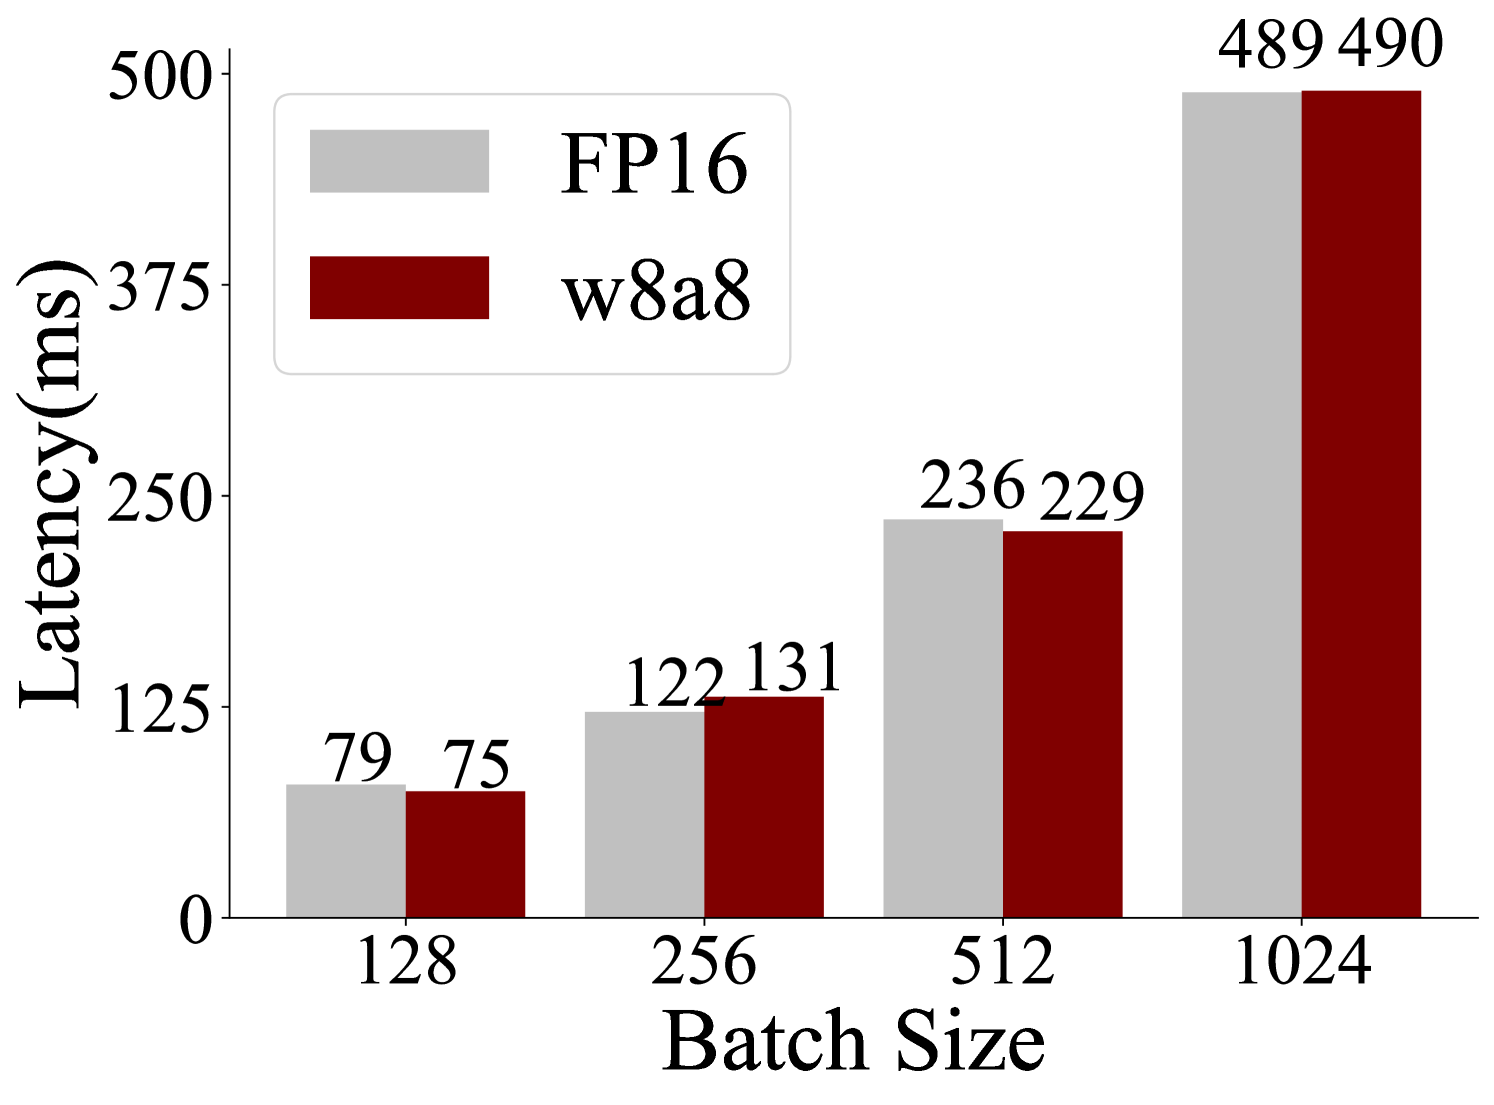
The chart compares latency (in milliseconds) for two computational methods, FP16 and w8a8, across four batch sizes: 128, 256, 512, and 1024. Latency values are displayed as numerical labels on top of each bar, with FP16 represented in gray and w8a8 in maroon.
### Components/Axes
- **X-axis (Batch Size)**: Labeled with values 128, 256, 512, and 1024.
- **Y-axis (Latency)**: Scaled from 0 to 500 ms in increments of 125.
- **Legend**: Positioned in the top-left corner, associating gray with FP16 and maroon with w8a8.
- **Bars**: Paired bars for each batch size, with numerical labels (e.g., "79" for FP16 at 128 batch size).
### Detailed Analysis
- **Batch Size 128**:
- FP16: 79 ms (gray bar).
- w8a8: 75 ms (maroon bar).
- **Batch Size 256**:
- FP16: 122 ms (gray bar).
- w8a8: 131 ms (maroon bar).
- **Batch Size 512**:
- FP16: 236 ms (gray bar).
- w8a8: 229 ms (maroon bar).
- **Batch Size 1024**:
- FP16: 489 ms (gray bar).
- w8a8: 490 ms (maroon bar).
### Key Observations
1. **Trend Verification**:
- FP16 latency increases monotonically with batch size (79 → 122 → 236 → 489 ms).
- w8a8 latency initially rises (75 → 131 ms), dips slightly at 512 (229 ms), then peaks at 1024 (490 ms).
2. **Notable Patterns**:
- w8a8 outperforms FP16 at smaller batch sizes (128 and 256).
- At 512 batch size, FP16 latency exceeds w8a8 by 7 ms.
- At 1024 batch size, latencies are nearly identical (FP16: 489 ms, w8a8: 490 ms).
### Interpretation
The data suggests that the w8a8 method is more efficient than FP16 for smaller batch sizes (128 and 256), likely due to optimized memory or computational handling. However, as batch size increases, the efficiency gap narrows, with w8a8 showing a minor advantage at 512 and near-parity at 1024. The slight dip in w8a8 latency at 512 may indicate an optimization threshold, while the convergence at 1024 implies diminishing returns for larger batches. This could inform hardware/software tuning for specific workloads.