## Charts/Graphs: Super GNN Training & Prediction Analysis
### Overview
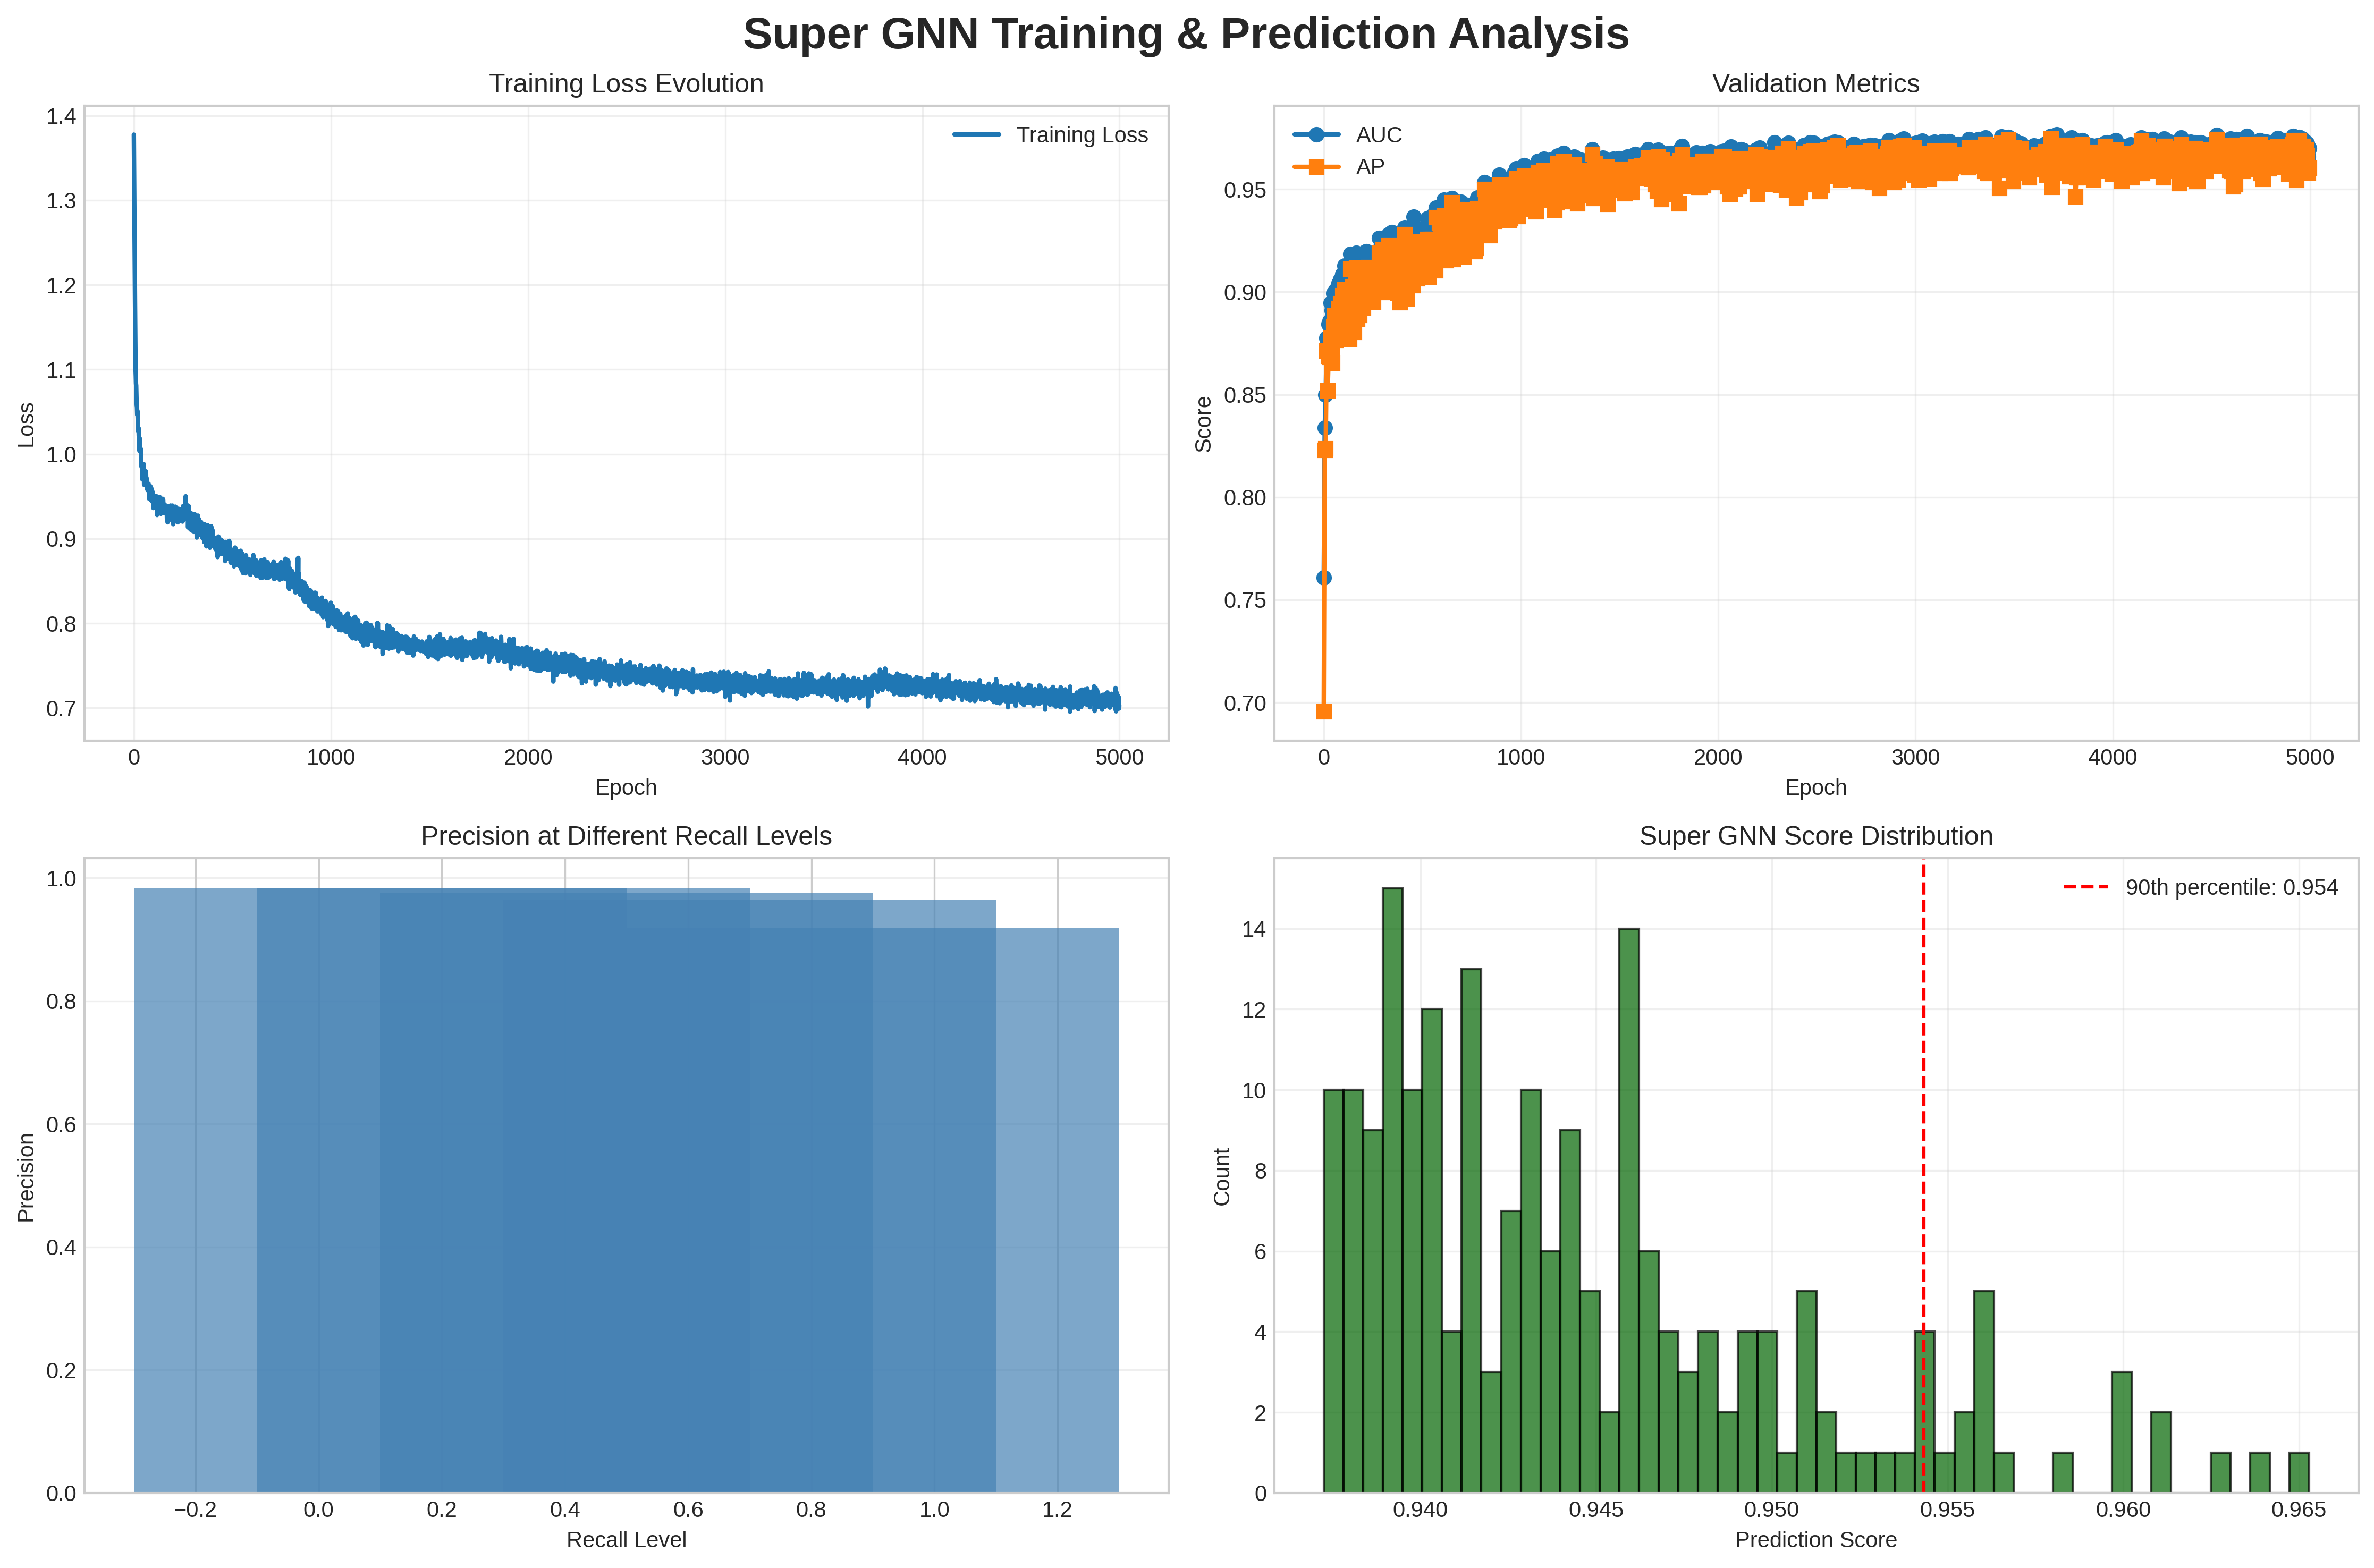
The image presents a series of four charts visualizing the training and prediction performance of a Super Graph Neural Network (GNN). The charts display training loss evolution, validation metrics (AUC and AP), precision at different recall levels, and the distribution of prediction scores.
### Components/Axes
* **Chart 1: Training Loss Evolution**
* X-axis: Epoch (0 to 5000, with increments of 500)
* Y-axis: Loss (0.7 to 1.4, with increments of 0.1)
* Data Series: Training Loss (Blue line)
* **Chart 2: Validation Metrics**
* X-axis: Epoch (0 to 5000, with increments of 500)
* Y-axis: Score (0.7 to 1.0, with increments of 0.05)
* Data Series: AUC (Blue line), AP (Orange line)
* Legend: AUC (Blue), AP (Orange)
* **Chart 3: Precision at Different Recall Levels**
* X-axis: Recall Level (-0.2 to 1.2, with increments of 0.2)
* Y-axis: Precision (0.0 to 1.0, with increments of 0.2)
* Data Series: Bar chart representing precision for each recall level.
* **Chart 4: Super GNN Score Distribution**
* X-axis: Prediction Score (0.940 to 0.965, with increments of 0.005)
* Y-axis: Count (0 to 14, with increments of 2)
* Data Series: Histogram representing the distribution of prediction scores.
* Vertical Line: 90th percentile (Red dashed line at approximately 0.954)
### Detailed Analysis or Content Details
* **Chart 1: Training Loss Evolution**
* The Training Loss line starts at approximately 1.35 and generally slopes downward, indicating decreasing loss as the number of epochs increases. The decrease is most rapid in the first 1000 epochs, then slows down, with some fluctuations. At epoch 5000, the loss is approximately 0.72.
* **Chart 2: Validation Metrics**
* The AUC line starts at approximately 0.75 and increases rapidly to around 0.97 within the first 1000 epochs. It then plateaus with minor fluctuations, remaining around 0.97 until epoch 5000.
* The AP line starts at approximately 0.75 and increases similarly to AUC, reaching around 0.96 within the first 1000 epochs. It also plateaus, remaining around 0.96 until epoch 5000.
* **Chart 3: Precision at Different Recall Levels**
* The precision values increase as the recall level increases.
* Precision at Recall Level -0.2: Approximately 0.1
* Precision at Recall Level 0.0: Approximately 0.3
* Precision at Recall Level 0.2: Approximately 0.5
* Precision at Recall Level 0.4: Approximately 0.65
* Precision at Recall Level 0.6: Approximately 0.75
* Precision at Recall Level 0.8: Approximately 0.85
* Precision at Recall Level 1.0: Approximately 0.9
* Precision at Recall Level 1.2: Approximately 0.95
* **Chart 4: Super GNN Score Distribution**
* The histogram shows a concentration of prediction scores between 0.940 and 0.955.
* The 90th percentile is indicated by a red dashed line at approximately 0.954. This means 90% of the prediction scores are below 0.954.
* The highest count (approximately 13) occurs around a prediction score of 0.945.
### Key Observations
* The training loss decreases significantly during the initial epochs, suggesting rapid learning.
* Both AUC and AP metrics converge to high values (around 0.97 and 0.96 respectively), indicating good predictive performance.
* Precision generally increases with recall, as expected.
* The prediction score distribution is concentrated in a narrow range around 0.95, with the 90th percentile at 0.954.
### Interpretation
The data suggests that the Super GNN model is effectively trained and achieves high predictive performance. The decreasing training loss and converging validation metrics (AUC and AP) indicate successful learning and generalization. The precision-recall curve demonstrates a trade-off between precision and recall, which is typical in classification tasks. The distribution of prediction scores shows that the model is confident in its predictions, with most scores clustered around 0.95. The 90th percentile being at 0.954 suggests that the model is consistently making predictions with a high degree of confidence. There are no obvious outliers or anomalies in the data. The model appears to be well-calibrated and performs consistently well across the validation set.