# Technical Document Extraction
## Data Table
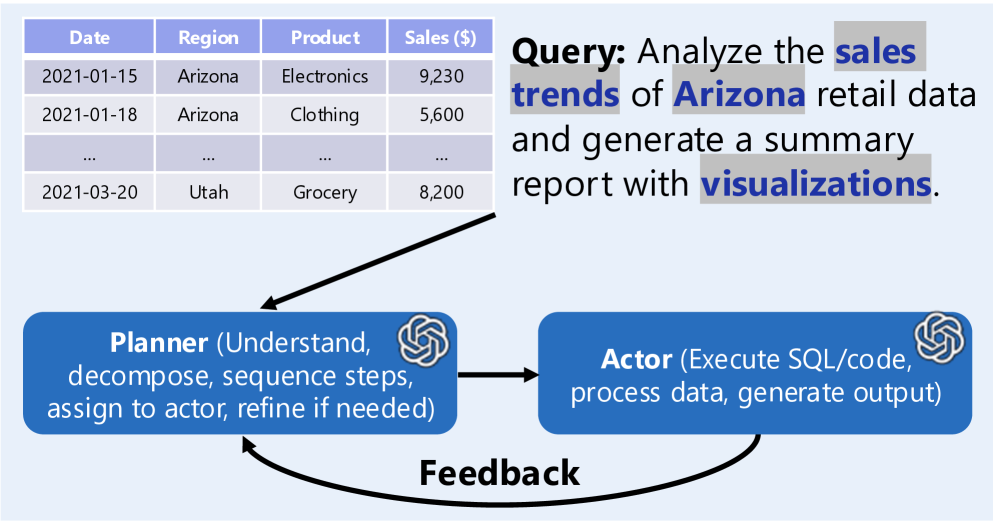
| Date | Region | Product | Sales ($) |
|------------|----------|-----------|-----------|
| 2021-01-15 | Arizona | Electronics | 9,230 |
| 2021-01-18 | Arizona | Clothing | 5,600 |
| ... | ... | ... | ... |
| 2021-03-20 | Utah | Grocery | 8,200 |
### Key Observations:
- **Temporal Scope**: Data spans from January 15, 2021, to March 20, 2021.
- **Geographic Focus**: Arizona (primary) and Utah (single entry).
- **Product Categories**: Electronics, Clothing, Grocery.
- **Sales Values**:
- Electronics: $9,230 (highest)
- Clothing: $5,600
- Grocery: $8,200
## Query
**Text**:
"Analyze the sales trends of Arizona retail data and generate a summary report with visualizations."
### Breakdown:
- **Objective**: Analyze sales trends.
- **Scope**: Arizona retail data.
- **Deliverables**: Summary report with visualizations.
## Flowchart Components
### 1. Planner
- **Responsibilities**:
- Understand requirements.
- Decompose tasks.
- Sequence steps.
- Assign to Actor.
- Refine if needed.
- **Symbol**: Blue rectangle with white text.
### 2. Actor
- **Responsibilities**:
- Execute SQL/code.
- Process data.
- Generate output.
- **Symbol**: Blue rectangle with white text.
### 3. Feedback Loop
- **Direction**: Actor → Planner.
- **Label**: "Feedback."
## Diagram Flow
1. **Planner** initiates task decomposition.
2. **Actor** executes assigned tasks (SQL/code).
3. **Feedback** ensures iterative refinement.
## Spatial Grounding
- **Data Table**: Positioned at the top-left of the image.
- **Query**: Located in the top-right corner.
- **Flowchart**: Occupies the lower half, with directional arrows indicating process flow.
## Trend Verification
- **Data Series**: No explicit trends visible in the table (only three entries). The ellipsis suggests additional data points exist but are not shown.
- **Hypothesis**: Sales trends may vary by product category and date, but further analysis is required.
## Component Isolation
- **Header**: Query text (top-right).
- **Main Chart**: Data table (top-left).
- **Footer**: Flowchart (bottom half).
## Final Notes
- **Language**: All text is in English.
- **Missing Elements**: No legends, axis titles, or numerical trends explicitly depicted in the image.
- **Assumptions**: The ellipsis in the table implies incomplete data; the flowchart suggests an iterative process between Planner and Actor.