## Line Chart: LM Loss vs. Position
### Overview
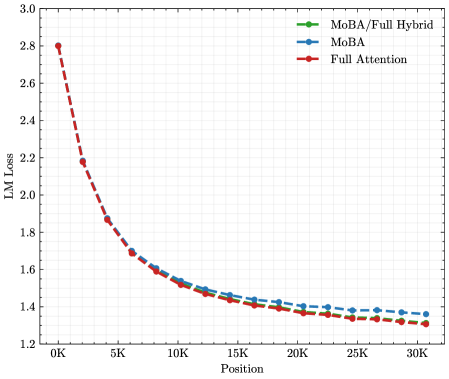
The image presents a line chart illustrating the relationship between LM Loss (Language Modeling Loss) and Position, likely representing the sequence length or a similar positional metric. Three different models or configurations are compared: MoBA/Full Hybrid, MoBA, and Full Attention. The chart displays how the LM Loss changes as the position increases for each model.
### Components/Axes
* **X-axis:** Position, ranging from 0K to 30K. The axis is labeled "Position".
* **Y-axis:** LM Loss, ranging from 1.2 to 3.0. The axis is labeled "LM Loss".
* **Legend:** Located in the top-right corner of the chart.
* MoBA/Full Hybrid (Green line with diamond markers)
* MoBA (Blue line with circle markers)
* Full Attention (Red line with circle markers)
* **Grid:** A light gray grid is present in the background to aid in reading values.
### Detailed Analysis
The chart shows three distinct lines representing the LM Loss for each model as a function of position.
* **Full Attention (Red):** This line starts at approximately 2.8 at 0K position and exhibits a steep downward trend, decreasing rapidly to around 1.6 at 5K position. The decline continues, but at a slower rate, reaching approximately 1.35 at 30K position.
* **MoBA (Blue):** This line begins at approximately 1.7 at 0K position and shows a gradual decrease. It reaches around 1.35 at 5K position and continues to decrease slowly, leveling off around 1.25 at 30K position.
* **MoBA/Full Hybrid (Green):** This line starts at approximately 1.6 at 0K position and decreases steadily. It reaches around 1.3 at 5K position and continues to decrease, leveling off around 1.25 at 30K position.
Here's a more detailed breakdown of approximate values:
| Position (K) | Full Attention (LM Loss) | MoBA (LM Loss) | MoBA/Full Hybrid (LM Loss) |
|--------------|---------------------------|----------------|-----------------------------|
| 0 | 2.8 | 1.7 | 1.6 |
| 5 | 1.6 | 1.35 | 1.3 |
| 10 | 1.45 | 1.3 | 1.28 |
| 15 | 1.4 | 1.28 | 1.27 |
| 20 | 1.37 | 1.27 | 1.26 |
| 25 | 1.36 | 1.26 | 1.25 |
| 30 | 1.35 | 1.25 | 1.25 |
### Key Observations
* The "Full Attention" model consistently exhibits the highest LM Loss across all positions, especially at lower positions.
* Both "MoBA" and "MoBA/Full Hybrid" models demonstrate significantly lower LM Loss compared to "Full Attention".
* The rate of decrease in LM Loss is most pronounced for the "Full Attention" model in the initial stages (0K to 5K position).
* The "MoBA" and "MoBA/Full Hybrid" models converge towards similar LM Loss values at higher positions (20K to 30K).
### Interpretation
The data suggests that the MoBA and MoBA/Full Hybrid models are more efficient in language modeling, as indicated by their lower LM Loss values, compared to the Full Attention model. The steep initial decline in LM Loss for the Full Attention model suggests that it benefits significantly from increased position/sequence length, but it ultimately plateaus at a higher loss than the MoBA variants. The convergence of the MoBA models at higher positions indicates that the benefits of the "Full Hybrid" approach diminish as the position increases. This could be due to the hybrid model leveraging the strengths of both MoBA and Full Attention, but the Full Attention component becomes less critical at longer sequences. The chart demonstrates the trade-offs between different attention mechanisms in language modeling, highlighting the potential advantages of MoBA-based approaches. The fact that the MoBA models reach a lower loss suggests they are better at capturing long-range dependencies or are more robust to the challenges of longer sequences.