\n
## Diagram: Network Models of Observation
### Overview
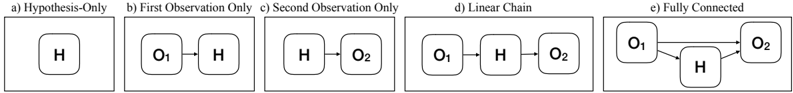
The image presents five distinct diagrams, labeled a through e, illustrating different network models of observation. Each diagram depicts a series of rounded rectangles representing entities (H, O1, O2) connected by arrows indicating relationships or flow. The diagrams are arranged horizontally.
### Components/Axes
The diagrams are labeled as follows:
* a) Hypothesis-Only
* b) First Observation Only
* c) Second Observation Only
* d) Linear Chain
* e) Fully Connected
The entities represented are:
* H
* O1
* O2
The arrows represent relationships between the entities.
### Detailed Analysis or Content Details
**a) Hypothesis-Only:**
* Contains a single rounded rectangle labeled "H".
* No connections or arrows are present.
**b) First Observation Only:**
* Contains three rounded rectangles labeled "O1", "H", and "O1" from left to right.
* An arrow points from the first "O1" to "H".
**c) Second Observation Only:**
* Contains three rounded rectangles labeled "H", "O2", and "O2" from left to right.
* An arrow points from "H" to the first "O2".
**d) Linear Chain:**
* Contains three rounded rectangles labeled "O1", "H", and "O2" from left to right.
* An arrow points from "O1" to "H".
* An arrow points from "H" to "O2".
**e) Fully Connected:**
* Contains three rounded rectangles labeled "O1", "O2", and "H".
* An arrow points from "O1" to "H".
* An arrow points from "O2" to "H".
* An arrow points from "O1" to "O2".
### Key Observations
The diagrams demonstrate increasing complexity in network connections. Diagram (a) represents a baseline with no connections. Diagrams (b) and (c) show simple, unidirectional relationships. Diagram (d) introduces a linear sequence of observations. Diagram (e) represents a fully interconnected network where all entities are directly related to each other.
### Interpretation
These diagrams likely represent different models for how observations are made and related to a hypothesis.
* **(a) Hypothesis-Only:** Represents a starting point where only a hypothesis exists, without any observational data.
* **(b) First Observation Only:** Shows the initial observation (O1) influencing the hypothesis (H).
* **(c) Second Observation Only:** Shows a second observation (O2) influencing the hypothesis (H).
* **(d) Linear Chain:** Represents a sequential process where one observation leads to another, mediated by the hypothesis.
* **(e) Fully Connected:** Suggests a more complex, iterative process where observations influence each other and the hypothesis simultaneously.
The progression from (a) to (e) could illustrate a learning process or the development of a more refined understanding of a phenomenon through repeated observation and analysis. The diagrams are conceptual and do not contain numerical data, but they visually represent different relationships between a hypothesis and observations. The use of "O1" and "O2" suggests multiple observations are being considered. The diagrams are a visual representation of a conceptual framework, rather than a presentation of empirical data.