# Technical Document Analysis: Subarray Conflict Ratio Chart
## 1. Labels and Axis Titles
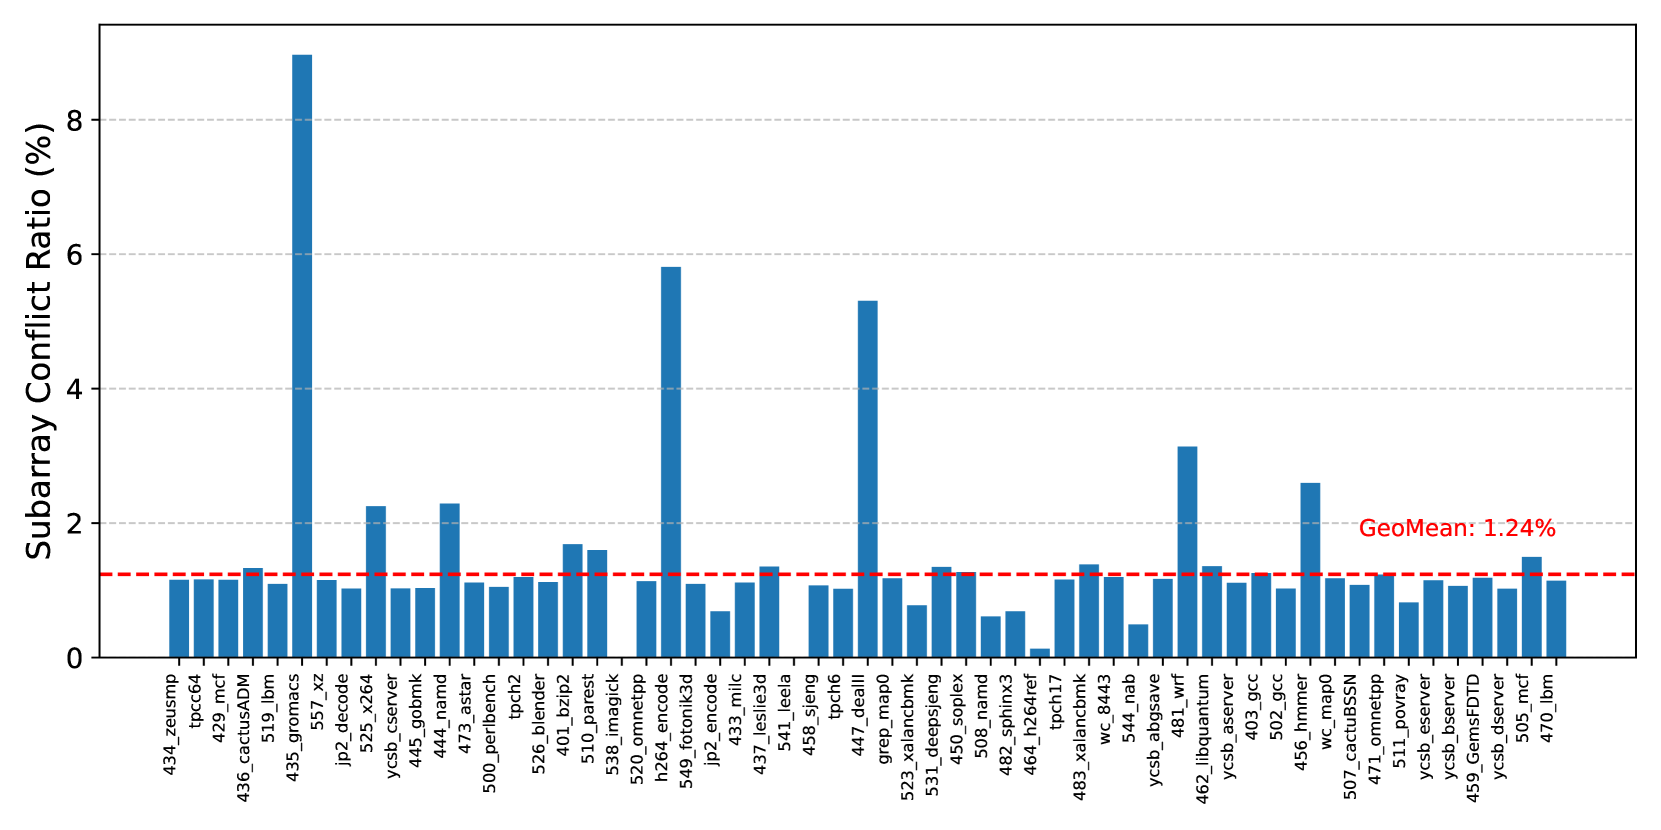
- **Title**: "Subarray Conflict Ratio (%)"
- **X-Axis**:
- Labels:
- 434_zeusmp, tpcc64, 429_mcf, 436_cactusADM, 519_lbm, 435_gromacs, 557_xz, jp2_decode, 525_x264, ycsb_cserver, 445_gobmk, 444_namd, 473_astar, 500_perlbench, tpch2, 526_blender, 401_bzip2, 510_parest, 538_imagic, 520_omnetpp, h264_encode, 549_fotonik3d, jp2_encode, 433_milc, 437_leslie3d, 541_leela, 458_sjeng, tpch6, 447_deall, grep_map0, 523_xalancbmk, 531_deepsjeng, 450_soplex, 508_namd, 482_sphinx3, 464_h264ref, tpch17, 483_xalancbmk, wc_8443, 544_nab, ycsb_abgsave, 481_wrf, 462_liquantum, ycsb_aserver, 403_gcc, 502_gcc, 456_hmmer, wc_map0, 507_cactuBSSN, 471_omnetpp, 511_povray, ycsb_eserver, ycsb_bserver, ycsb_GemsFDTD, 459_GemsFDTD, ycsb_deserver, 505_mcf, 470_lbm
- Ticks: 0%, 2%, 4%, 6%, 8%, 10%
- **Y-Axis**: "Subarray Conflict Ratio (%)"
- **Legend**: Not visible in the image. However, the red dashed line is labeled "GeoMean: 1.24%".
## 2. Categories and Sub-Categories
- **X-Axis Categories**:
- All labels listed above (60 total).
- **Y-Axis Categories**:
- Numerical values: 0%, 2%, 4%, 6%, 8%, 10%.
## 3. Embedded Text
- **GeoMean Label**: "GeoMean: 1.24%" (red dashed line).
## 4. Data Table
- **No explicit data table** is present. Data is represented as bars in the chart.
## 5. Legend Color/Label Verification
- **Legend Color**: Not visible. However, the red dashed line corresponds to the "GeoMean: 1.24%" label.
- **Data Point Colors**: All bars are blue, matching the implied legend for "Subarray Conflict Ratio (%)".
## 6. Spatial Grounding
- **Legend Placement**: Not visible in the image.
- **Bar Colors**: Blue (matches the implied legend for "Subarray Conflict Ratio (%)").
## 7. Trend Verification
- **Visual Trends**:
- Most bars are below the GeoMean line (1.24%).
- **Highest Bars**:
- 435_gromacs (~9%).
- h264_encode (~5.8%).
- tpch6 (~5.5%).
- 462_liquantum (~3.1%).
- 456_cactuBSSN (~2.6%).
- 502_gcc (~1.5%).
- **Lowest Bar**: 464_h264ref (~0.1%).
## 8. Component Isolation
- **Header**: Title "Subarray Conflict Ratio (%)".
- **Main Chart**:
- Bars representing subarray conflict ratios.
- Red dashed line for GeoMean (1.24%).
- **Footer**: "GeoMean: 1.24%" label.
## 9. Additional Notes
- **No other languages** are present in the image.
- **No data table** is explicitly shown; data is represented visually as bars.
- **All labels and axis markers** are transcribed as per the image.