## Bar Chart: Subarray Conflict Ratio
### Overview
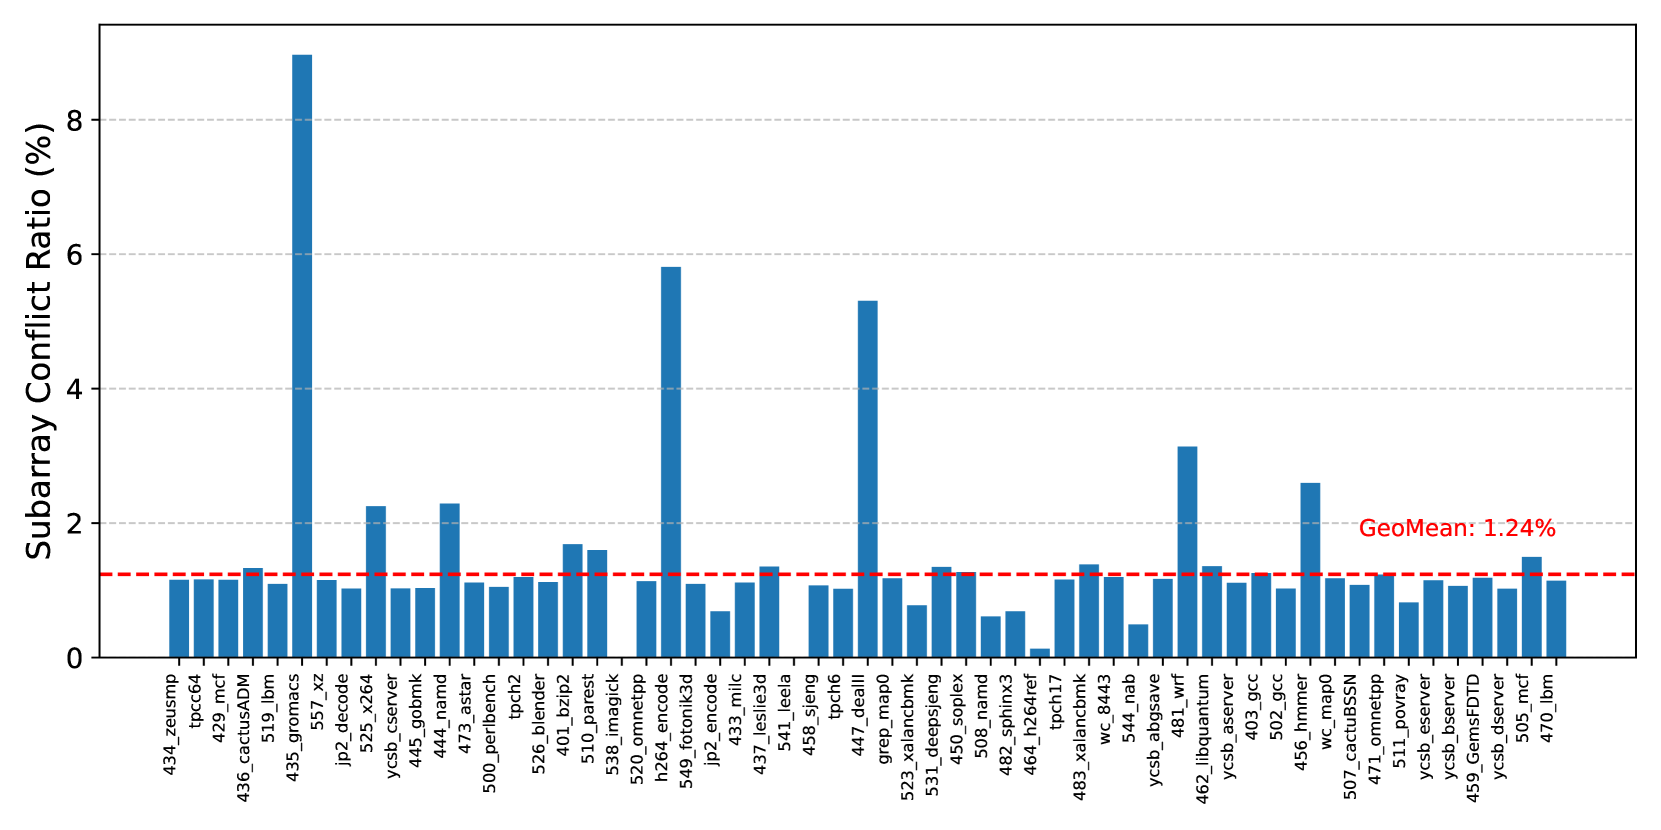
The image is a bar chart displaying the subarray conflict ratio (in percentage) for a variety of benchmarks. The x-axis represents the benchmark names, and the y-axis represents the subarray conflict ratio. A horizontal red dashed line indicates the geometric mean of the conflict ratios.
### Components/Axes
* **Title:** Subarray Conflict Ratio (%)
* **X-axis:** Benchmark names (e.g., 434\_zeusmp, tpcc64, 429\_mcf, etc.). The labels are rotated for readability.
* **Y-axis:** Subarray Conflict Ratio (%), ranging from 0 to 8 with increments of 2.
* **Horizontal Line:** A red dashed line labeled "GeoMean: 1.24%"
### Detailed Analysis
The bar chart shows the subarray conflict ratio for a number of benchmarks. The majority of the bars are clustered around the geometric mean (1.24%), with a few notable exceptions.
Here's a breakdown of some key data points:
* **434\_zeusmp:** Approximately 1.2%
* **tpcc64:** Approximately 1.2%
* **429\_mcf:** Approximately 1.2%
* **436\_cactusADM:** Approximately 1.2%
* **519\_lbm:** Approximately 1.2%
* **435\_gromacs:** Approximately 7.5% - This is a significant outlier.
* **557\_xz:** Approximately 1.2%
* **jp2\_decode:** Approximately 1.2%
* **525\_x264:** Approximately 2.3%
* **ycsb\_cserver:** Approximately 2.3%
* **445\_gobmk:** Approximately 1.2%
* **444\_namd:** Approximately 1.2%
* **473\_astar:** Approximately 1.2%
* **500\_perlbench:** Approximately 1.2%
* **tpch2:** Approximately 1.2%
* **526\_blender:** Approximately 1.2%
* **401\_bzip2:** Approximately 1.2%
* **510\_parest:** Approximately 1.2%
* **538\_imagick:** Approximately 1.2%
* **520\_omnetpp:** Approximately 6.0% - Another significant value.
* **h264\_encode:** Approximately 1.2%
* **549\_fotonik3d:** Approximately 1.2%
* **jp2\_encode:** Approximately 1.2%
* **433\_milc:** Approximately 1.2%
* **437\_leslie3d:** Approximately 1.2%
* **541\_leela:** Approximately 1.2%
* **458\_sjeng:** Approximately 1.2%
* **tpch6:** Approximately 1.2%
* **447\_dealll:** Approximately 1.2%
* **grep\_map0:** Approximately 1.2%
* **523\_xalancbmk:** Approximately 1.0%
* **531\_deepsjeng:** Approximately 0.6%
* **450\_soplex:** Approximately 1.2%
* **508\_namd:** Approximately 1.2%
* **482\_sphinx3:** Approximately 0.3%
* **464\_h264ref:** Approximately 1.2%
* **tpch17:** Approximately 1.2%
* **483\_xalancbmk:** Approximately 1.2%
* **wc\_8443:** Approximately 1.2%
* **544\_nab:** Approximately 1.2%
* **ycsb\_abgsave:** Approximately 3.0%
* **481\_wrf:** Approximately 1.2%
* **462\_libquantum:** Approximately 1.2%
* **ycsb\_aserver:** Approximately 1.2%
* **403\_gcc:** Approximately 1.2%
* **502\_gcc:** Approximately 1.2%
* **456\_hmmer:** Approximately 2.7%
* **wc\_map0:** Approximately 1.2%
* **507\_cactuBSSN:** Approximately 4.0%
* **471\_omnetpp:** Approximately 1.2%
* **511\_povray:** Approximately 1.2%
* **ycsb\_eserver:** Approximately 1.2%
* **ycsb\_bserver:** Approximately 1.2%
* **459\_GemsFDTD:** Approximately 1.2%
* **ycsb\_dserver:** Approximately 1.2%
* **505\_mcf:** Approximately 1.2%
* **470\_lbm:** Approximately 1.0%
### Key Observations
* The geometric mean of the subarray conflict ratio across all benchmarks is 1.24%.
* The benchmark "435\_gromacs" has a significantly higher subarray conflict ratio (approximately 7.5%) compared to the other benchmarks.
* The benchmark "520\_omnetpp" also shows a high subarray conflict ratio (approximately 6.0%).
* The benchmark "507\_cactuBSSN" also shows a high subarray conflict ratio (approximately 4.0%).
* The benchmark "ycsb\_abgsave" also shows a high subarray conflict ratio (approximately 3.0%).
* The benchmark "456\_hmmer" also shows a high subarray conflict ratio (approximately 2.7%).
* The benchmark "482\_sphinx3" has a significantly lower subarray conflict ratio (approximately 0.3%) compared to the other benchmarks.
### Interpretation
The bar chart illustrates the variability in subarray conflict ratios across different benchmarks. The high conflict ratios observed in "435\_gromacs", "520\_omnetpp", "507\_cactuBSSN", "ycsb\_abgsave", and "456\_hmmer" suggest that these benchmarks may have memory access patterns that lead to more conflicts within subarrays. The low conflict ratio in "482\_sphinx3" suggests a more favorable memory access pattern. The geometric mean provides a central tendency for comparison, highlighting which benchmarks deviate significantly from the average. These deviations could be due to differences in data structures, algorithms, or memory allocation strategies employed by the benchmarks.