## Pie Charts: Knowledge Graph and Language Model Usage
### Overview
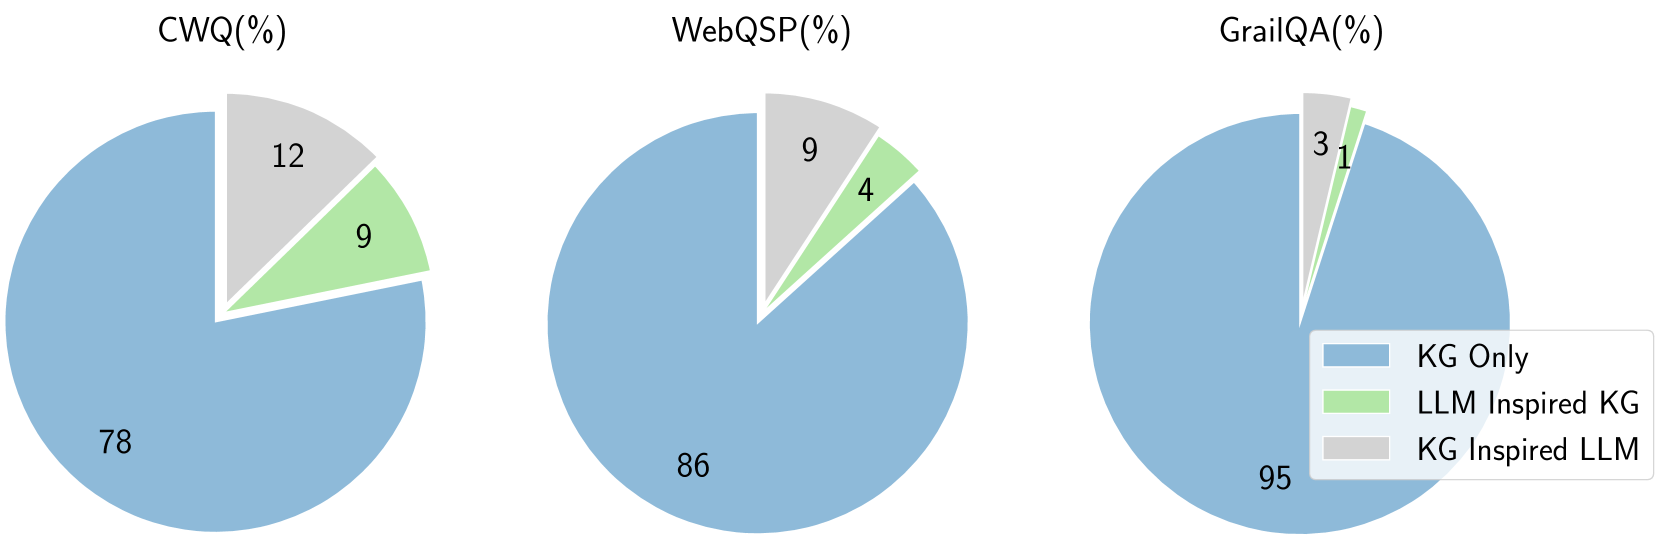
The image presents three pie charts comparing the usage of Knowledge Graphs (KG) and Language Models (LLM) in three different question answering datasets: CWQ, WebQSP, and GrailQA. Each pie chart is divided into three segments representing the percentage of questions answered using "KG Only", "LLM Inspired KG", and "KG Inspired LLM" approaches.
### Components/Axes
* **Titles:** CWQ(%), WebQSP(%), GrailQA(%) - These indicate the dataset associated with each pie chart.
* **Pie Chart Segments:**
* **Blue:** KG Only
* **Light Green:** LLM Inspired KG
* **Light Gray:** KG Inspired LLM
* **Legend:** Located at the bottom-right of the image, it maps the colors to the corresponding approaches.
### Detailed Analysis
**1. CWQ(%) Pie Chart (Left)**
* **KG Only (Blue):** 78%
* **LLM Inspired KG (Light Green):** 9%
* **KG Inspired LLM (Light Gray):** 12%
**2. WebQSP(%) Pie Chart (Center)**
* **KG Only (Blue):** 86%
* **LLM Inspired KG (Light Green):** 4%
* **KG Inspired LLM (Light Gray):** 9%
**3. GrailQA(%) Pie Chart (Right)**
* **KG Only (Blue):** 95%
* **LLM Inspired KG (Light Green):** 1%
* **KG Inspired LLM (Light Gray):** 3%
### Key Observations
* Across all three datasets, the "KG Only" approach dominates, representing the largest segment in each pie chart.
* The "LLM Inspired KG" approach has the smallest representation in GrailQA (1%) compared to CWQ (9%) and WebQSP (4%).
* The "KG Inspired LLM" approach has the largest representation in CWQ (12%) compared to WebQSP (9%) and GrailQA (3%).
### Interpretation
The pie charts suggest that Knowledge Graphs are heavily relied upon for answering questions in these datasets. The "KG Only" approach consistently accounts for the majority of the answers. The influence of Language Models, either inspiring the KG or being inspired by the KG, varies across the datasets. GrailQA appears to be the most KG-centric, with minimal contribution from LLM-related approaches. CWQ shows a more balanced distribution, with a relatively higher percentage of questions answered using LLM-inspired methods. WebQSP falls in between, with a moderate reliance on KG and some influence from LLMs.
This data could indicate differences in the complexity or structure of the datasets, or variations in the types of questions asked. It also highlights the potential for further exploration of how LLMs can be effectively integrated with Knowledge Graphs to improve question answering performance.