\n
## Pie Charts: Performance Breakdown by Dataset
### Overview
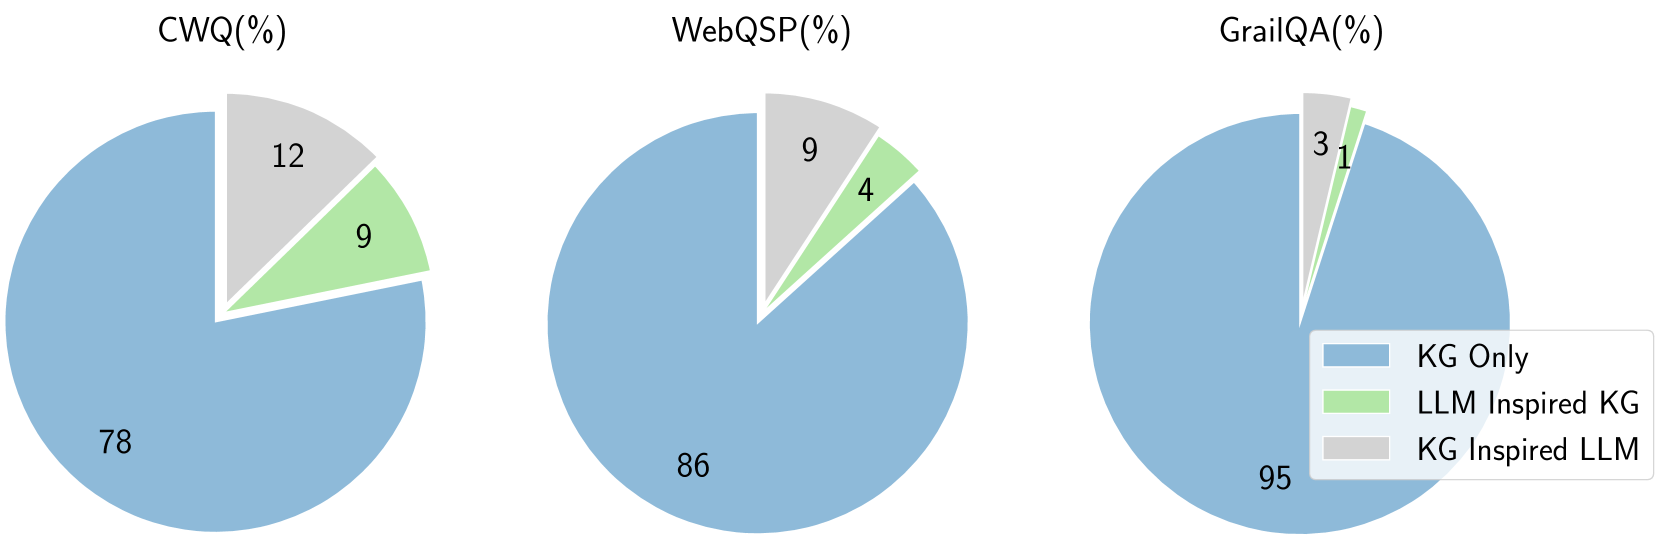
The image presents three pie charts, each representing the performance breakdown across different datasets: CWQ, WebQSP, and GrailQA. The charts illustrate the percentage contribution of three approaches: "KG Only", "LLM Inspired KG", and "KG Inspired LLM". All percentages are represented as whole numbers.
### Components/Axes
Each pie chart is labeled with the dataset name followed by "(%)", indicating percentages. A legend is positioned in the bottom-right corner, defining the colors associated with each approach:
* **KG Only:** Light Blue
* **LLM Inspired KG:** Light Green
* **KG Inspired LLM:** Pale Yellow
### Detailed Analysis or Content Details
**1. CWQ (%)**
* **KG Only:** 76% - Dominant segment, occupying the majority of the pie chart.
* **LLM Inspired KG:** 9% - A smaller segment, approximately one-eighth of the pie.
* **KG Inspired LLM:** 12% - A segment slightly larger than the "LLM Inspired KG" segment.
**2. WebQSP (%)**
* **KG Only:** 86% - The largest segment, representing the vast majority of the pie chart.
* **LLM Inspired KG:** 4% - The smallest segment, a very small slice of the pie.
* **KG Inspired LLM:** 9% - A segment larger than "LLM Inspired KG" but smaller than "KG Only".
**3. GrailQA (%)**
* **KG Only:** 95% - The overwhelmingly dominant segment, almost the entire pie chart.
* **LLM Inspired KG:** 1% - The smallest segment, a negligible portion of the pie.
* **KG Inspired LLM:** 3% - A small segment, slightly larger than "LLM Inspired KG".
### Key Observations
* The "KG Only" approach consistently outperforms the other two approaches across all three datasets.
* The contribution of "LLM Inspired KG" and "KG Inspired LLM" is relatively small compared to "KG Only".
* The "KG Only" approach is particularly dominant in the GrailQA dataset (95%).
* The "LLM Inspired KG" approach consistently has the lowest percentage contribution.
### Interpretation
The data suggests that, for these datasets (CWQ, WebQSP, and GrailQA), relying solely on Knowledge Graphs ("KG Only") yields the best performance. The incorporation of Large Language Models (LLMs) to enhance or inspire the Knowledge Graph construction or utilization ("LLM Inspired KG" and "KG Inspired LLM") provides only marginal improvements, and in some cases, even diminishes performance. This could indicate that the existing Knowledge Graphs are sufficient for these tasks, and the LLM integration doesn't add significant value, or that the LLM integration is not being done effectively. The extremely high performance of "KG Only" on GrailQA suggests this dataset is particularly well-suited to a Knowledge Graph-based approach. The consistent low performance of "LLM Inspired KG" suggests that the LLM's contribution to the KG construction is not improving the KG's ability to answer questions.