TECHNICAL ASSET FINGERPRINT
f0b3ecdf7fc6826e764ed324
Click to view fullscreen
Press ESC or click to close
FOUND IN PAPERS
EXPERT: healer-alpha-free VERSION 1
RUNTIME: free/openrouter/healer-alpha
INTEL_VERIFIED
## Matrix Array Comparison Diagram
### Overview
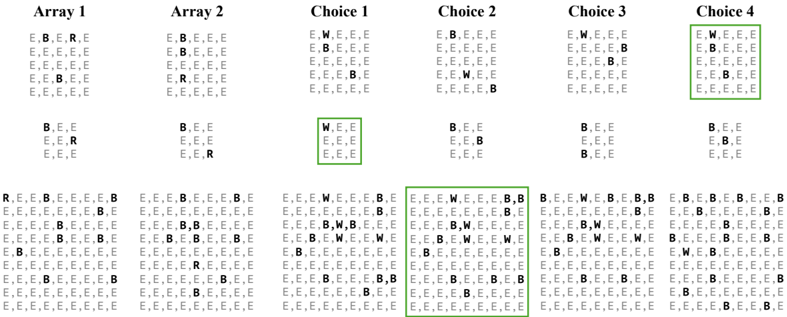
The image displays a technical diagram comparing two input arrays (Array 1 and Array 2) with four possible choice arrays (Choice 1 through Choice 4). Each array is represented as a pair of grids: a larger 5x5 matrix and a smaller 3x3 matrix below it. The grids contain categorical data represented by single letters. Below this comparison, five larger 9x9 grids are shown, likely representing combined or processed results. Green borders highlight specific choices and their corresponding result grids, indicating selection or correctness.
### Components/Axes
- **Titles**: Six column headers: "Array 1", "Array 2", "Choice 1", "Choice 2", "Choice 3", "Choice 4".
- **Grid Structures**:
- Each column contains a 5x5 grid (top) and a 3x3 grid (bottom).
- A bottom row contains five 9x9 grids, aligned roughly under the columns above.
- **Legend/Key**: Implicit from content:
- `E`: Likely represents "Empty" or default state.
- `B`: Likely represents "Blocked" or barrier.
- `R`: Likely represents "Root", "Start", or a reference point.
- `W`: Likely represents "Waypoint", "Target", or a goal.
- **Visual Highlighting**: Green rectangular borders surround:
- The entire 5x5 and 3x3 grids of **Choice 1**.
- The entire 5x5 grid of **Choice 4**.
- The second and third 9x9 grids in the bottom row (corresponding to Choice 1 and Choice 2).
### Detailed Analysis
#### Top Section: Input Arrays and Choices
**Array 1**
- **5x5 Grid**:
```
E, B, R, E, E
E, E, E, E, E
E, E, E, E, E
E, E, B, E, E
E, B, E, E, E
```
- **3x3 Grid**:
```
B, E, E
E, E, R
E, E, E
```
**Array 2**
- **5x5 Grid**:
```
E, B, E, E, E
E, E, E, E, E
E, E, E, E, E
E, R, E, E, E
E, E, E, E, E
```
- **3x3 Grid**:
```
B, E, E
E, E, E
E, E, R
```
**Choice 1** (Green Border)
- **5x5 Grid**:
```
E, W, E, E, E
E, B, E, E, E
E, E, E, E, E
E, E, E, B, E
E, E, E, E, E
```
- **3x3 Grid** (Green Border):
```
W, E, E
E, E, E
E, E, E
```
**Choice 2**
- **5x5 Grid**:
```
E, B, E, E, E
E, E, E, E, E
E, E, W, E, E
E, E, E, E, E
E, E, E, E, B
```
- **3x3 Grid**:
```
B, E, E
E, E, B
E, E, E
```
**Choice 3**
- **5x5 Grid**:
```
E, W, E, E, E
E, E, E, B, E
E, E, E, E, E
E, E, E, E, E
E, E, E, E, E
```
- **3x3 Grid**:
```
B, E, E
E, B, E
B, E, E
```
**Choice 4** (Green Border on 5x5 Grid)
- **5x5 Grid**:
```
E, W, E, E, E
E, B, E, E, E
E, E, E, E, E
E, E, E, B, E
E, E, E, E, E
```
- **3x3 Grid**:
```
B, E, E
E, B, E
E, E, E
```
#### Bottom Section: Result Grids (9x9)
**Bottom Grid 1** (Leftmost, under Arrays, no border)
```
R, E, E, B, E, E, E, E, B
E, E, E, E, E, E, E, B, E
E, E, E, B, E, E, E, E, E
E, E, B, E, E, E, B, E, E
E, E, E, E, E, B, E, E, E
E, E, E, E, B, E, E, E, E
E, E, E, B, E, E, E, E, E
E, E, B, E, E, E, E, E, E
E, B, E, E, E, E, E, E, E
```
**Bottom Grid 2** (Under Choice 1, Green Border)
```
E, E, E, W, E, E, E, E, B
E, E, E, E, E, E, E, B, E
E, E, E, B, E, E, E, E, E
E, E, B, E, E, E, B, E, E
E, E, E, E, E, B, E, E, E
E, E, E, E, B, E, E, E, E
E, E, E, B, E, E, E, E, E
E, E, B, E, E, E, E, E, E
E, B, E, E, E, E, E, E, E
```
**Bottom Grid 3** (Under Choice 2, Green Border)
```
E, E, E, W, E, E, E, E, B
E, E, E, E, E, E, E, B, E
E, E, E, B, E, E, E, E, E
E, E, B, E, E, E, B, E, E
E, E, E, E, E, B, E, E, E
E, E, E, E, B, E, E, E, E
E, E, E, B, E, E, E, E, E
E, E, B, E, E, E, E, E, E
E, B, E, E, E, E, E, E, E
```
**Bottom Grid 4** (Under Choice 3, no border)
```
B, E, E, W, E, E, B, B, B
E, B, E, E, E, B, E, E, B
E, E, B, E, E, E, E, E, E
E, E, E, B, E, E, E, E, E
E, E, E, E, B, E, E, E, E
E, E, E, E, E, B, E, E, E
E, E, E, E, E, E, B, E, E
E, E, E, E, E, E, E, B, E
E, E, E, E, E, E, E, E, B
```
**Bottom Grid 5** (Under Choice 4, no border)
```
E, B, E, B, E, E, E, E, B
E, E, B, E, E, E, E, B, E
E, E, E, B, E, E, E, E, E
E, E, E, E, B, E, E, E, E
E, E, E, E, E, B, E, E, E
E, E, E, E, E, E, B, E, E
E, E, E, E, E, E, E, B, E
E, E, E, E, E, E, E, E, B
E, E, E, E, E, E, E, E, E
```
### Key Observations
1. **Pattern of Non-E Elements**: The `B` (Blocked) elements often form diagonal or linear patterns, especially in the 9x9 grids. In Bottom Grids 1, 2, and 3, `B` elements create a clear diagonal from bottom-left to top-right.
2. **Position of `R` and `W`**:
- In input arrays, `R` appears in different positions: Array 1 has `R` at (1,3) in 5x5 and (2,3) in 3x3; Array 2 has `R` at (4,2) in 5x5 and (3,3) in 3x3.
- `W` appears only in the Choice arrays, not in the input arrays. Choice 1, 3, and 4 have `W` at (1,2) in their 5x5 grids. Choice 2 has `W` at (3,3).
3. **Green Border Correlation**: The green borders highlight Choice 1 and Choice 4 in the top section, and Bottom Grids 2 and 3 in the bottom section. Notably, Bottom Grid 2 corresponds to Choice 1, and Bottom Grid 3 corresponds to Choice 2 (not Choice 4). This suggests the highlighting may indicate correct or selected paths.
4. **Structural Similarity**: Bottom Grids 2 and 3 are identical in content, both highlighted with green borders. Bottom Grid 1 is similar but has `R` at (1,1) instead of `W` at (1,4). Bottom Grids 4 and 5 show different patterns, with more dispersed `B` elements.
### Interpretation
This diagram likely represents a **pathfinding or puzzle-solving algorithm** where the goal is to navigate from a start point (`R`) to a target (`W`) while avoiding obstacles (`B`). The input arrays (Array 1 and Array 2) define different obstacle configurations and start positions. The choices (Choice 1-4) propose different target (`W`) placements.
- **What the data suggests**: The green borders indicate that Choice 1 and Choice 4 are considered valid or optimal solutions based on the inputs. However, the bottom grids show that the outcomes for Choice 1 and Choice 2 are identical and highlighted, suggesting that Choice 2 might also be valid or that the system produces the same result for multiple choices.
- **Relationships**: The 9x9 grids appear to be composite maps merging the input arrays with the chosen target. The diagonal `B` pattern in the highlighted grids implies a clear path from bottom-left to top-right, with the `W` positioned along this path.
- **Anomalies**: Choice 4 is highlighted in the top section but does not have a corresponding highlighted bottom grid. This could indicate that Choice 4 is a valid input selection but its output grid (Bottom Grid 5) is not highlighted, possibly because it leads to a different or suboptimal result.
- **Underlying Logic**: The consistent diagonal of `B` elements in the successful outcomes suggests the algorithm favors paths that avoid dense obstacle clusters. The placement of `W` at (1,4) in the successful grids (Bottom Grids 2 and 3) may represent an optimal target location given the obstacle layout.
In summary, this is a visual representation of a decision process in a grid-based navigation problem, where certain choices lead to successful path configurations, as indicated by the green highlights. The diagram allows comparison of different strategies and their outcomes.
DECODING INTELLIGENCE...